AscenWork Technologies brings the power of Copilot AI to Power BI, revolutionizing the way businesses analyze data. With Copilot Power BI, you can streamline report creation, automate insights, and enhance decision-making with AI-driven analytics. Our expertise helps clients create reports in Power BI Desktop with Copilot.

Language Queries
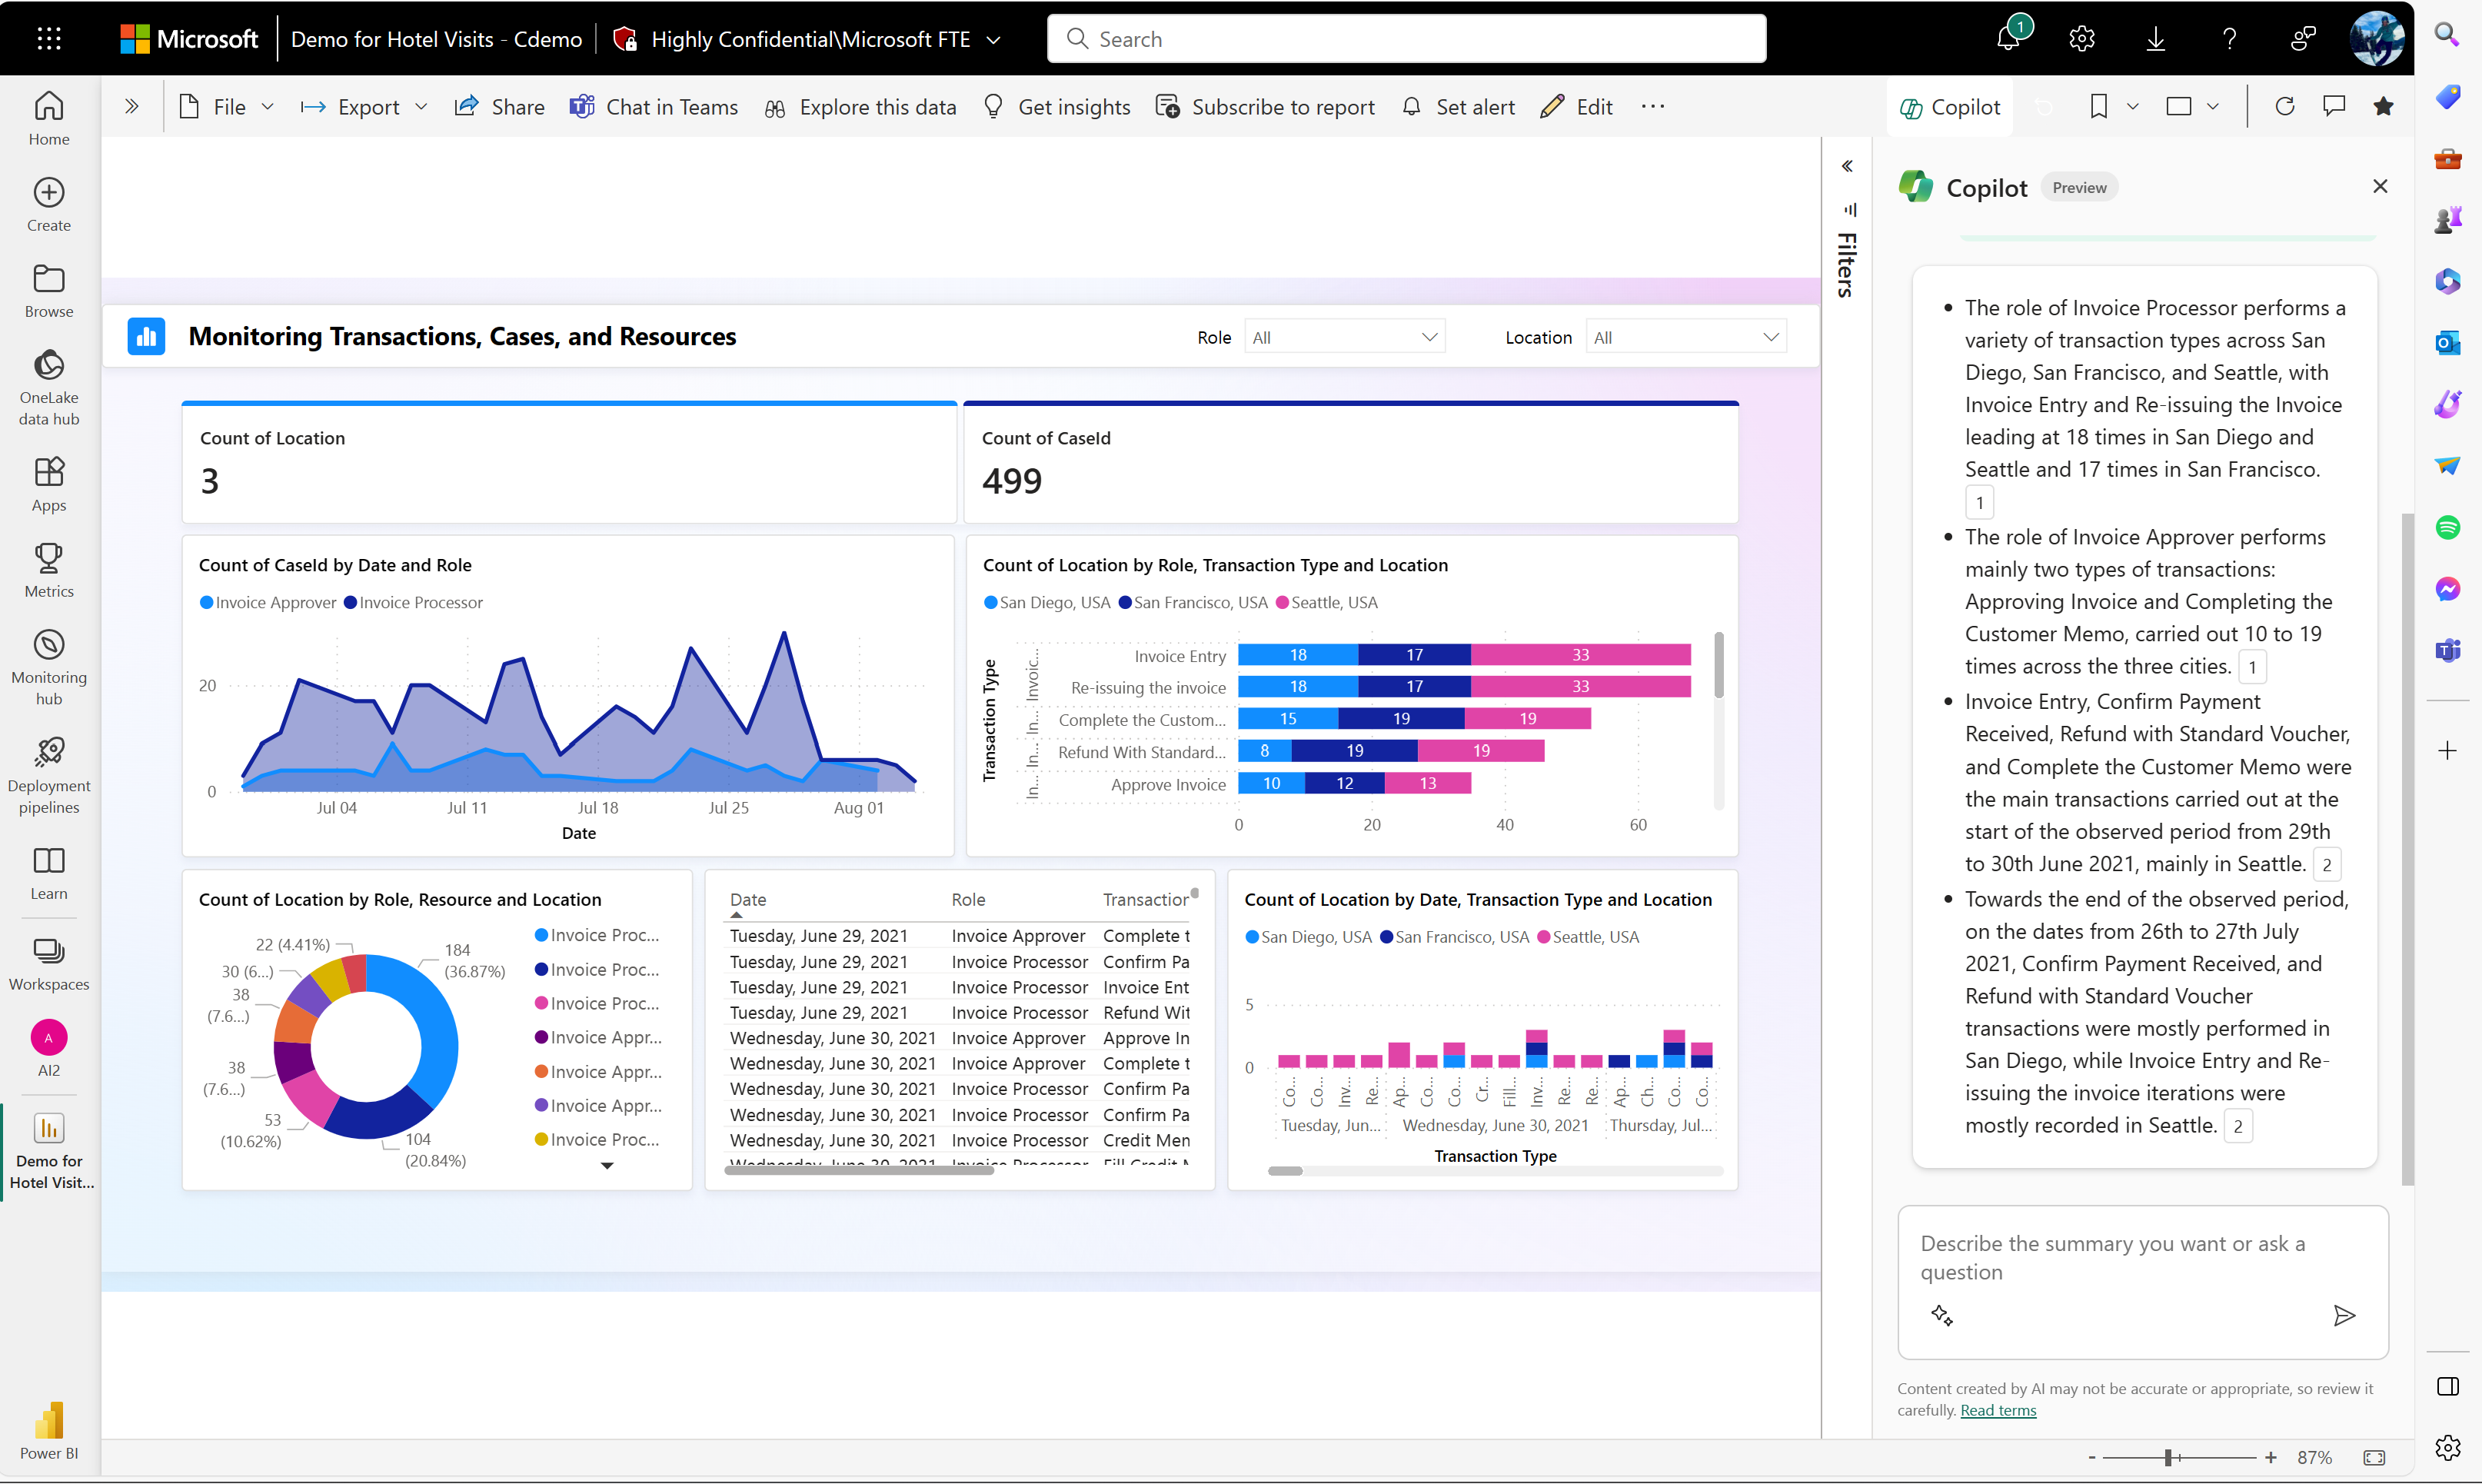
Ask questions directly in plain English, and Copilot generates visuals, and dashboards without the need for technical expertise.
Automated Insights
Identify patterns, anomalies, and trends effortlessly as Copilot analyzes your data and provides actionable recommendations.
Data Preparation
Simplify data cleaning and the transformation tasks, saving time and the ensuring accuracy in your datasets.
Custom Visualizations
Integration
Predictive Analysis
- Ensure you have the latest version of Power BI Desktop installed.
- Verify that your account has access to Copilot (available for certain Power BI plans).
- Log in with your Microsoft account and enable Copilot if prompted.
- Open Power BI Desktop and click Get Data.
- Choose the data source (e.g., Excel, SQL Server, SharePoint, etc.).
- Load the data by connecting and selecting relevant tables or datasets.

- Use Power Query Editor to clean and transform your data:
- Remove duplicates, filter rows, or fill missing values.
- Rename columns and define data types.
- Save the changes by clicking Close & Apply.
- Navigate to the Copilot Pane (usually on the right-hand side or enabled from the menu).
- Ensure Copilot is active; it might prompt you with suggestions.
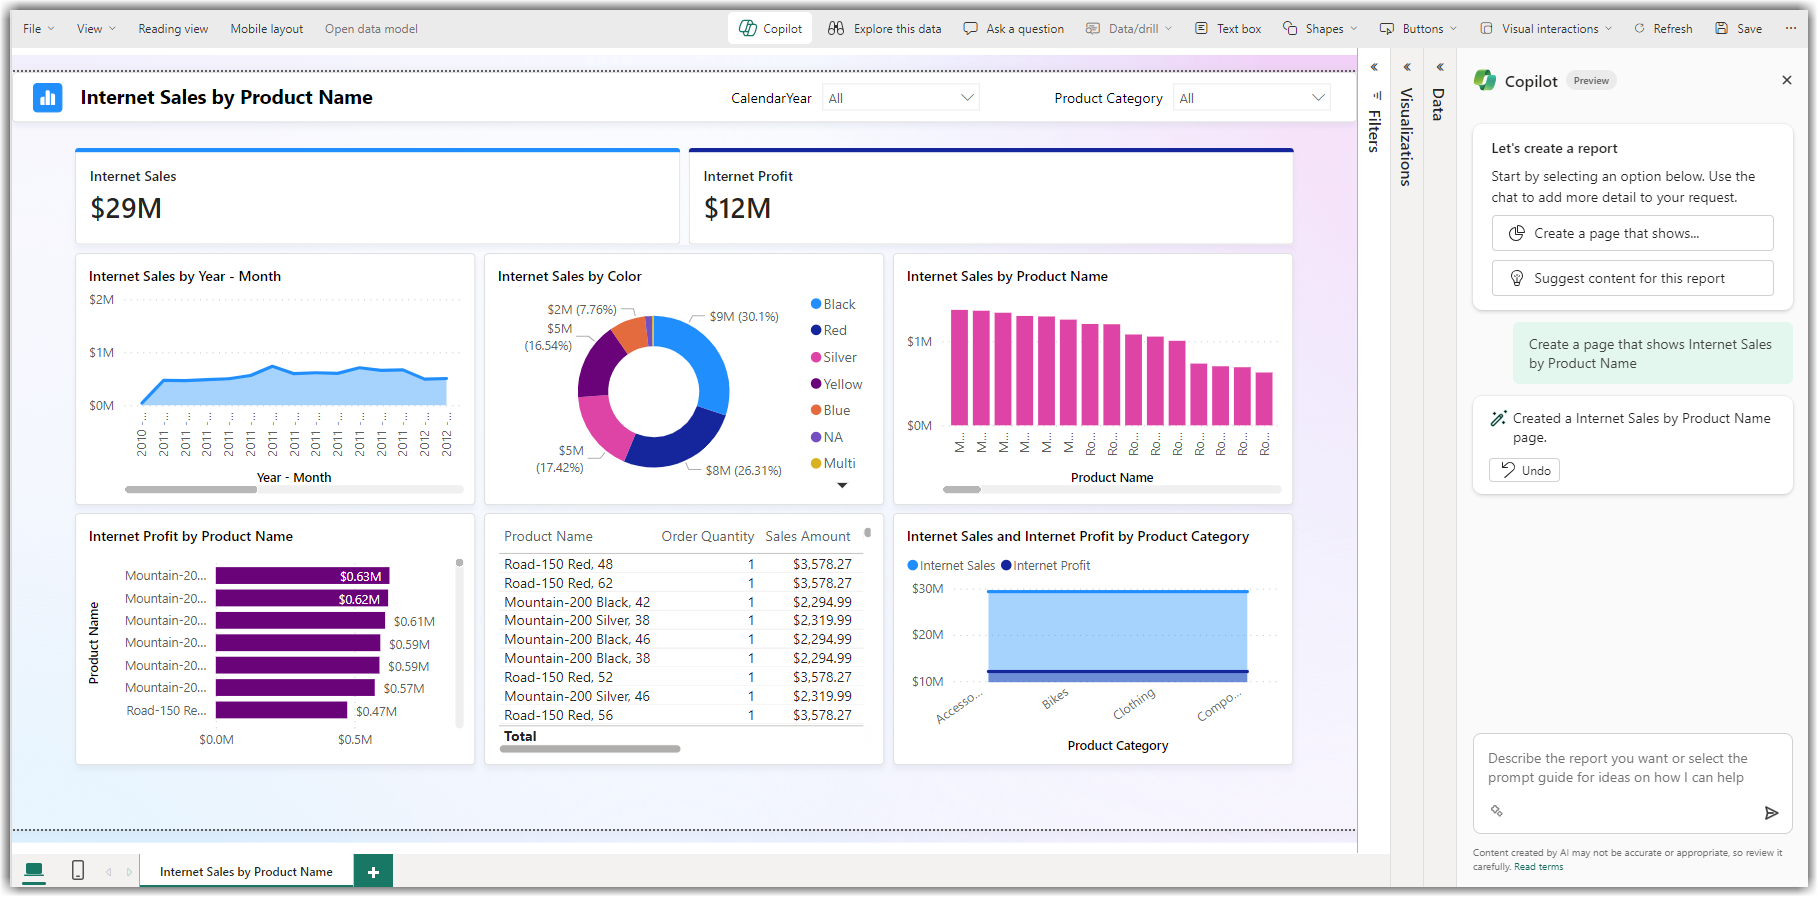
- In the Copilot chat interface:
- Describe your requirements: e.g., “Create a sales summary report by region for the last quarter.”
- Use natural language commands to request visualizations, calculations, or data insights.
- Copilot will generate suggestions, including DAX measures, data transformations, or visuals.
- Let Copilot guide you or manually create visuals:
- Choose Visualization Pane and drag fields into the canvas.
- Use visual types like bar charts, pie charts, or line graphs.
- Use Copilot to refine visuals:
- E.g., “Change the color scheme to blue” or “Add a trend line.”
- Use Copilot to suggest themes or designs.
- Manually adjust titles, fonts, or color schemes as needed.
- Align and resize visuals for a professional look.
To use Copilot in Power BI, your organization must first enable Copilot in Microsoft Fabric. Microsoft Fabric is a comprehensive software-as-a-service (SaaS) platform that integrates Power BI with other Microsoft services, providing a unified environment for data analytics and business intelligence. Accessing Microsoft Fabric requires a subscription through Microsoft Azure.
- Step 1: Go to Microsoft Fabric’s website and log in with your admin account credentials.
- Step 2: Go to Fabric Settings and select Admin Portal from the menu options.
- Step 3: Open the Fabric Admin Portal and go to Tenant settings. Here, you can search for the Copilot Settings for your organization.
- Step 4: Turn the switch on to enable Copilot in Fabric.
In addition to the above-mentioned steps, you have to perform two extra steps to enable Power BI Copilot with MS Fabric if Azure isn’t available in your region:
- Step 1: Switch on the setting that says Data sent to Azure OpenAI can be processed outside your capacity’s geographic region.
- Step 2: Select Apply to save this change.
Enable Copilot in Power BI by activating it through Microsoft Fabric, which requires a Microsoft Azure subscription.
Power BI Copilot requires a Microsoft Fabric F64+ capacity, plus Power BI licensing fees.
Copilot in Power BI is included with Microsoft Fabric F64+ capacity and requires Power BI Pro or Premium licenses.
Power BI Copilot offers AI-driven data analysis, automated visualizations, natural language queries, trend detection, and customizable report formatting.