Download 45+ Free Power BI Dashboard & Report Templates for Sales, Finance, Marketing, and More.
Get professionally designed Power BI dashboard layouts pre-loaded with common KPIs and filters. Jumpstart your analytics with sample PBIX files covering executive, sales, finance, HR, and other dashboards.
✅ Trusted by 500+ organizations worldwide
45+ Templates Available 10 Industries Covered 100% Editable
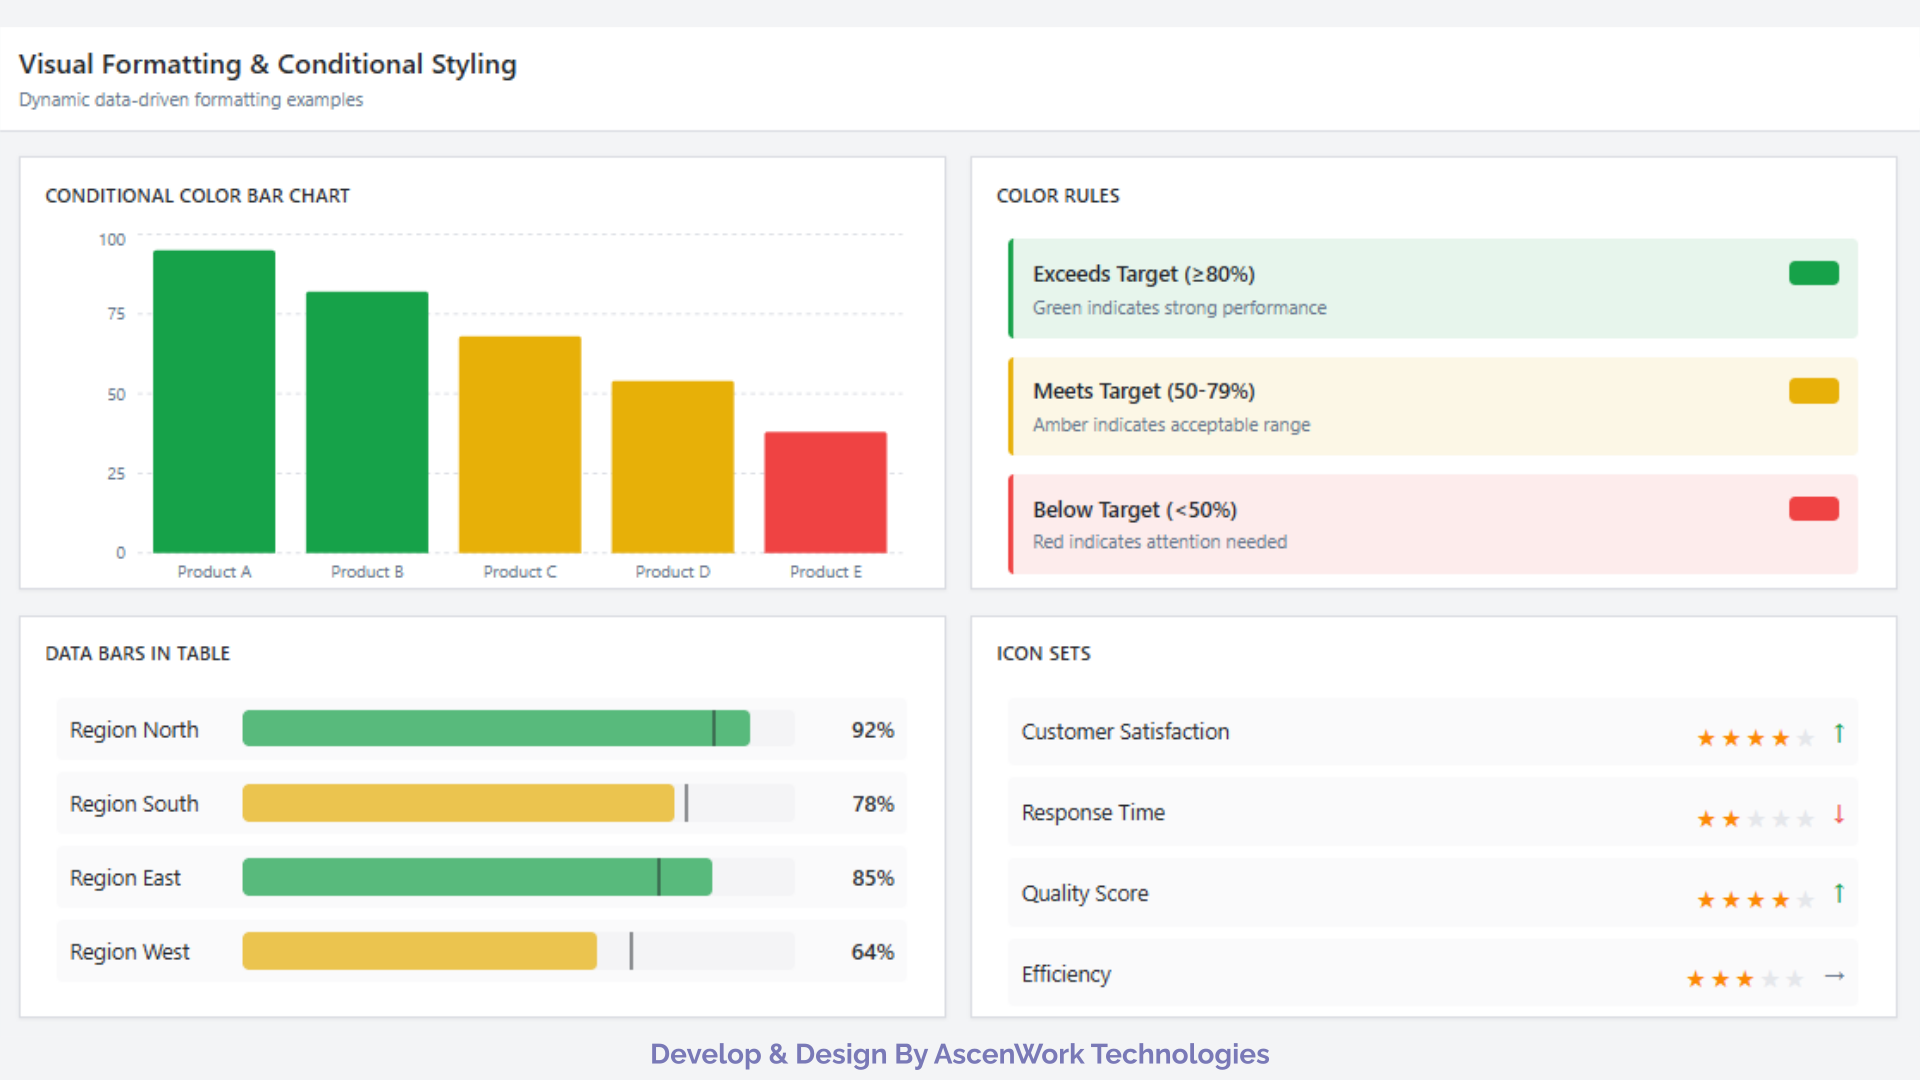
What Are Power BI Dashboard Templates?
A Power BI dashboard template is a pre-built Power BI report (PBIX file) that includes visualizations, data connections, and calculations for common business scenarios. Templates let you load your own data into a ready-made dashboard layout, saving hours of design work.
Businesses use Power BI templates to jumpstart reporting. They include best-practice KPIs and drill-down visuals, so analysts focus on insights instead of building dashboards from scratch. For example, a Sales Dashboard Template might include revenue, forecast vs. actual, and top customer charts ready to fill with your data.
Benefits
- Rapid Deployment: Launch reports in minutes instead of days.
- Best-Practice Layouts: Pre-configured KPI structure ensures critical metrics are highlighted.
- Customization: Edit charts, colors, and data sources easily to match your needs.
- Consistency: Use the same template for all projects to standardize reporting.
Who Should Use Them: Power BI analysts, BI developers, and managers across sales, finance, marketing, HR, etc., who need faster, consistent reporting.
Why Power BI: Power BI is widely adopted (over 500,000 companies) and supports rich visuals. Templates leverage Microsoft’s ecosystem – connect Excel, SQL, SharePoint data easily. They work with Power BI Desktop (free) and can be shared via Power BI Service.
Experience modern SharePoint design in action. Book a personalized demo with our experts today!
Power BI Dashboard Template Categories
Browse our Power BI templates organized by function and industry. Click each category to see template examples tailored to that area.
Executive Dashboard Templates
Dashboards designed for C-level executives, combining financial, sales, and operational KPIs. For example: revenue vs target, net profit trends, customer satisfaction gauges. Focus is on high-level summaries.
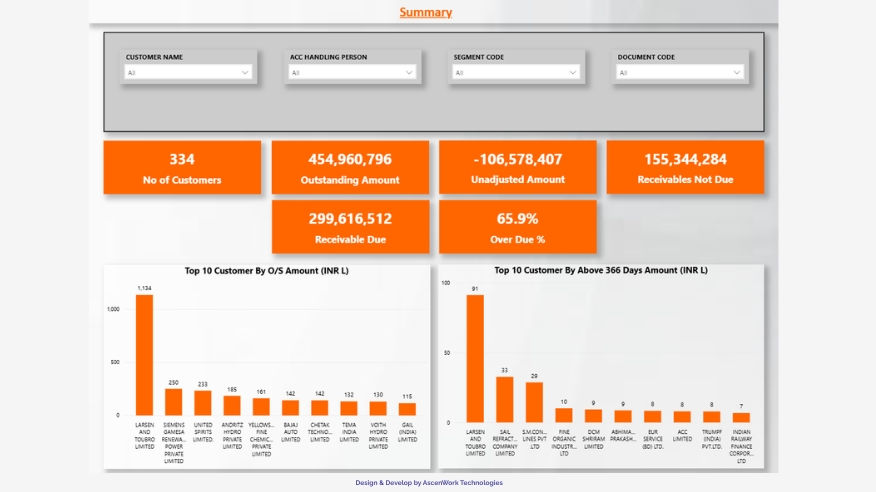
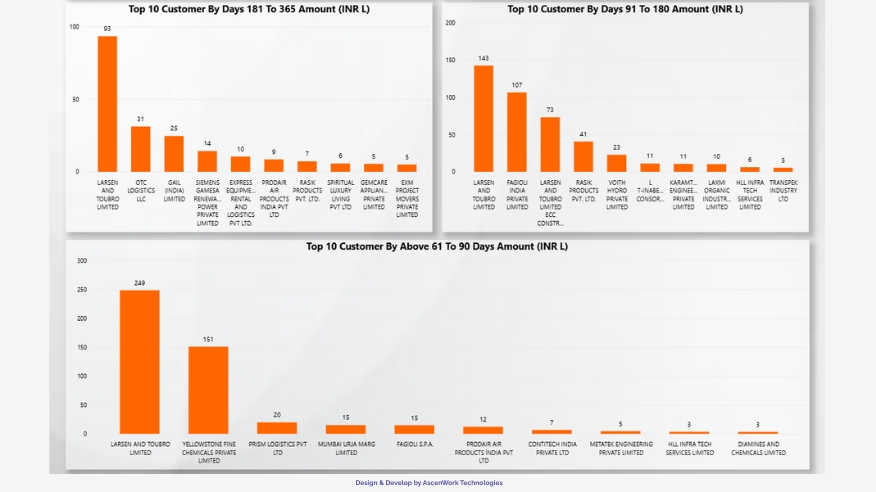
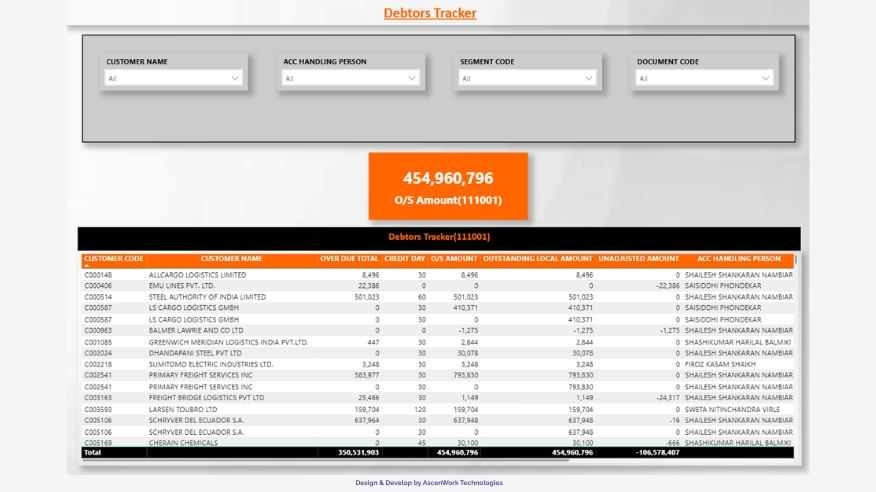
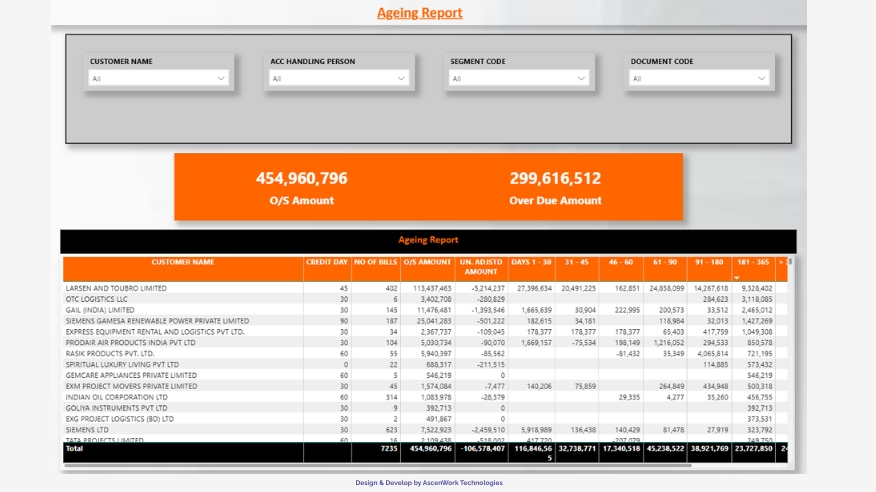
Sales Dashboard Templates
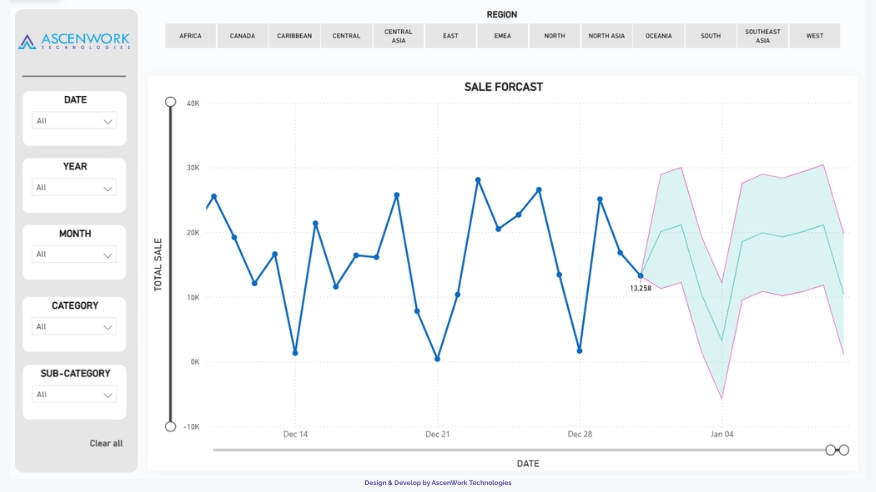
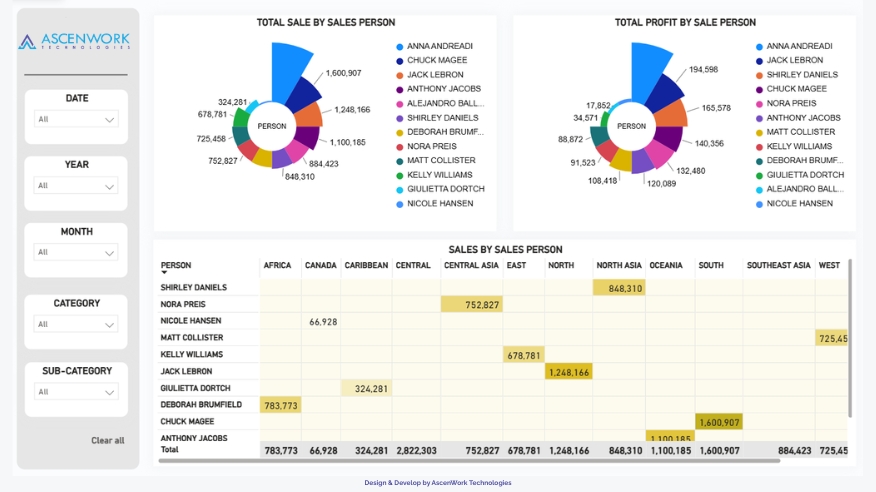
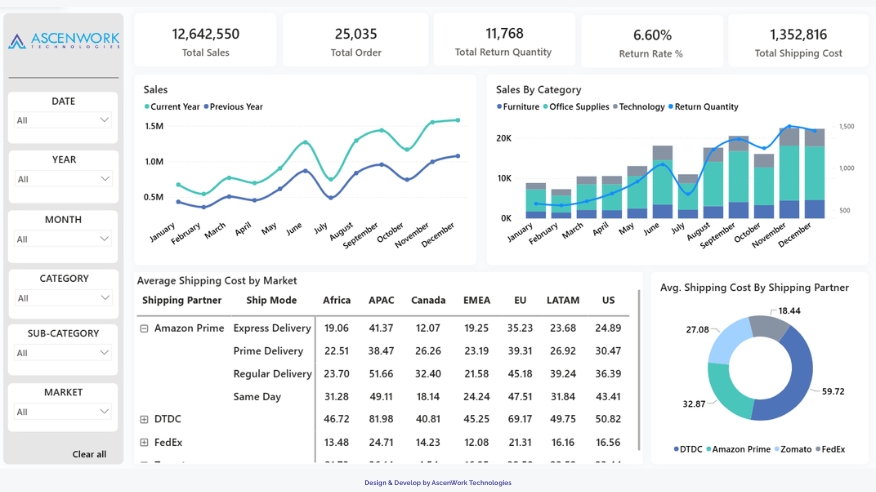
Visualizations for sales performance: revenue charts, lead pipelines, top products by sales. Example: monthly sales trend line, top regions bar chart. Helps sales teams track targets and conversions.
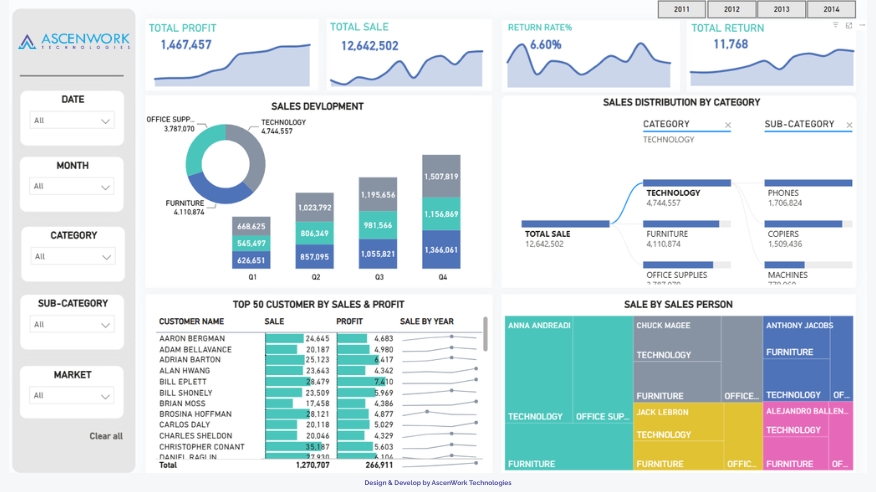
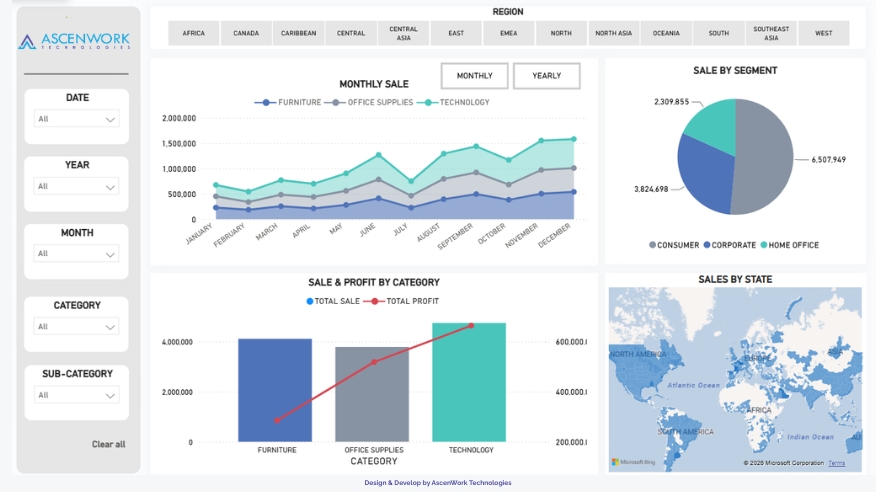
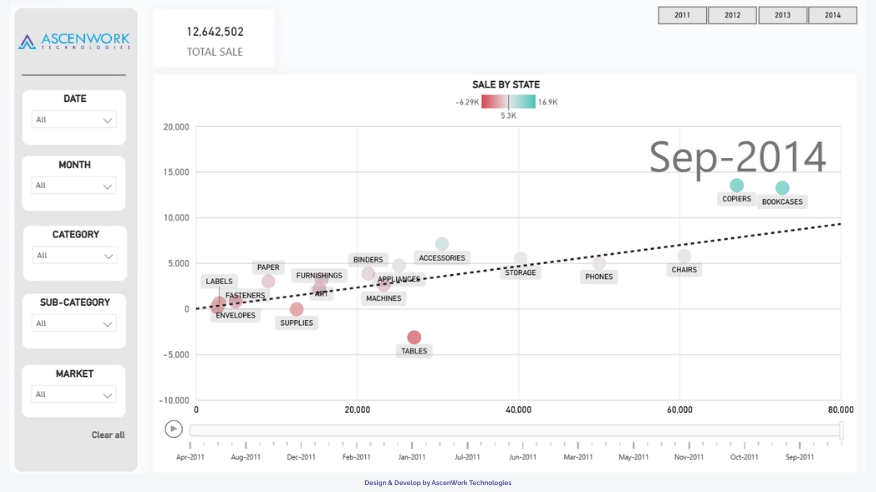
Finance Dashboard Templates
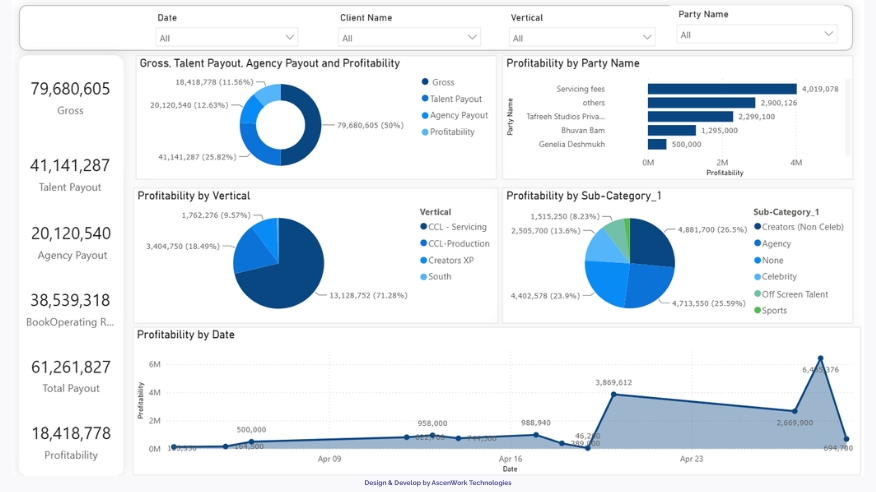
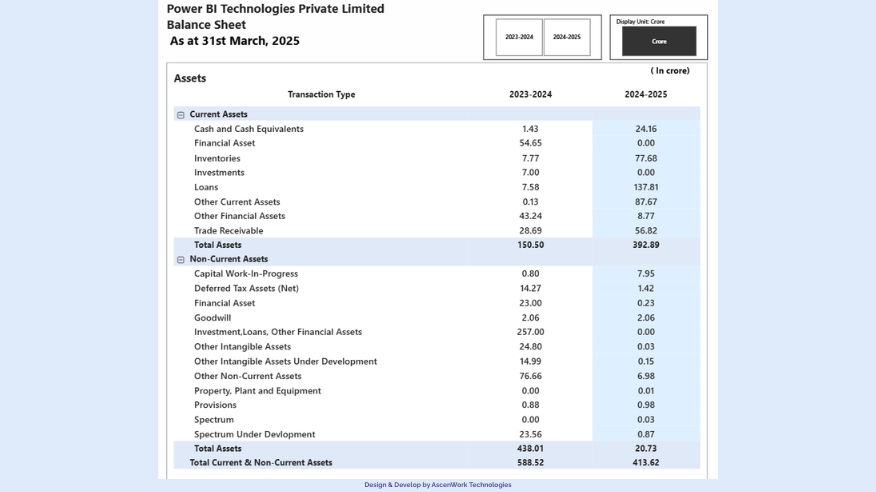
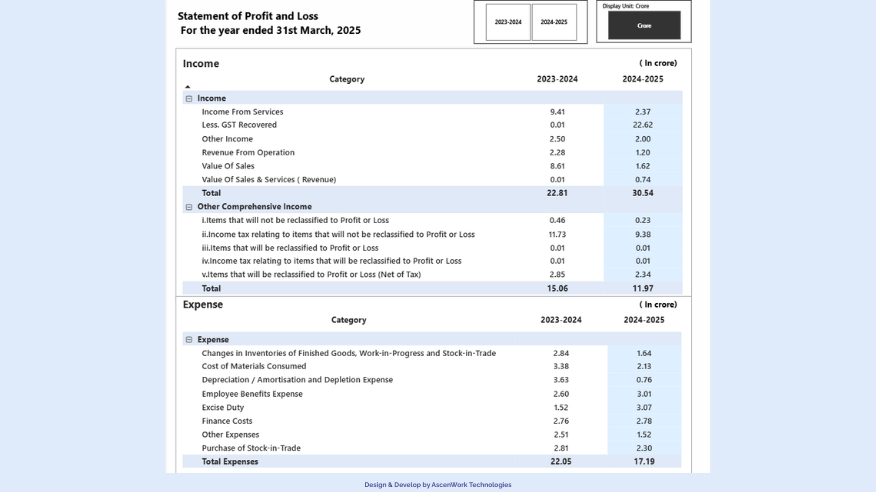
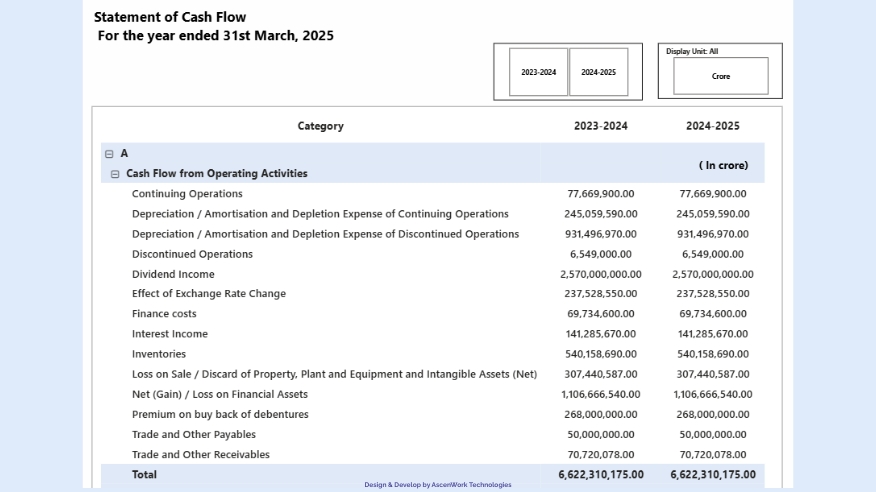
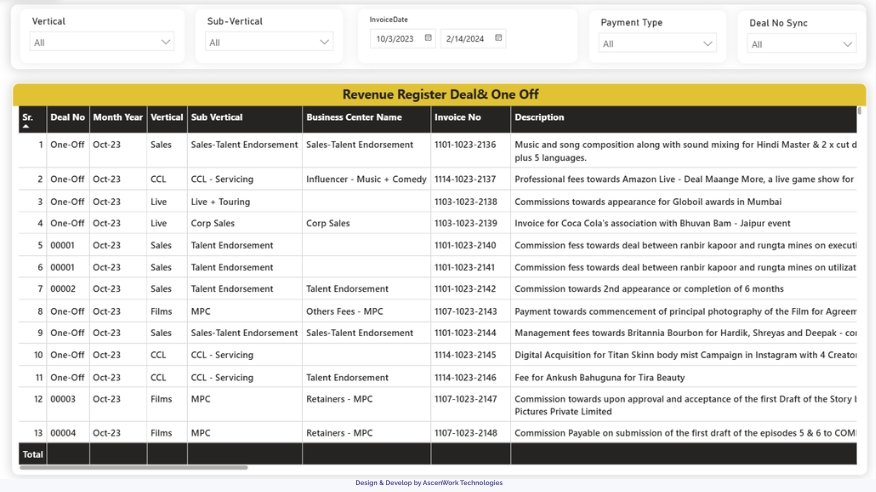
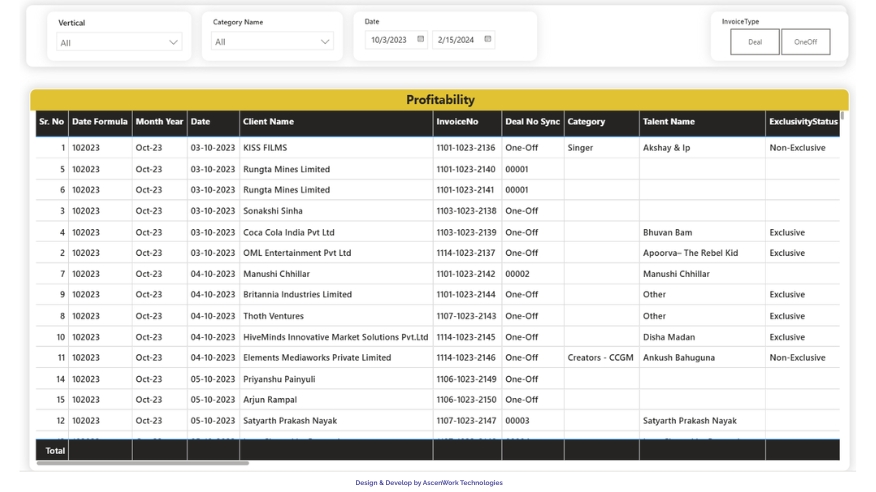
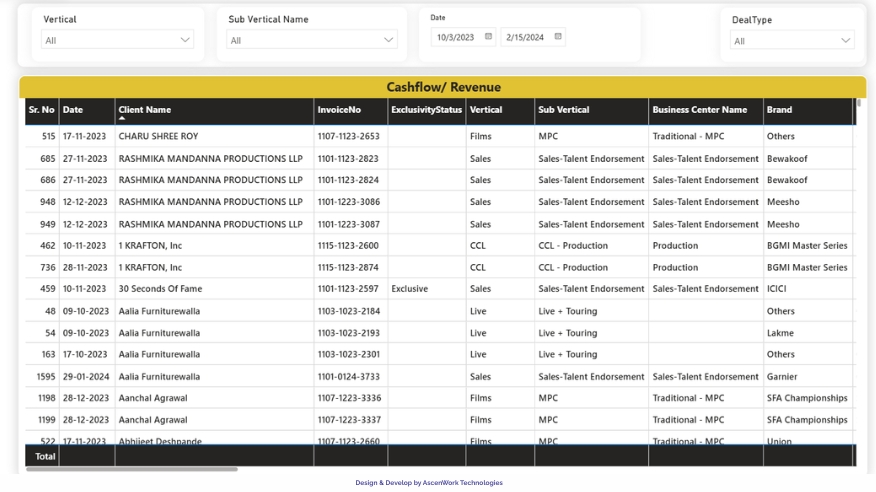
Focus on financial metrics: profit & loss, budget vs actual, cash flow visualizations. Includes tables for expenses and key indicators (ROI, growth). Useful for CFOs and finance teams.
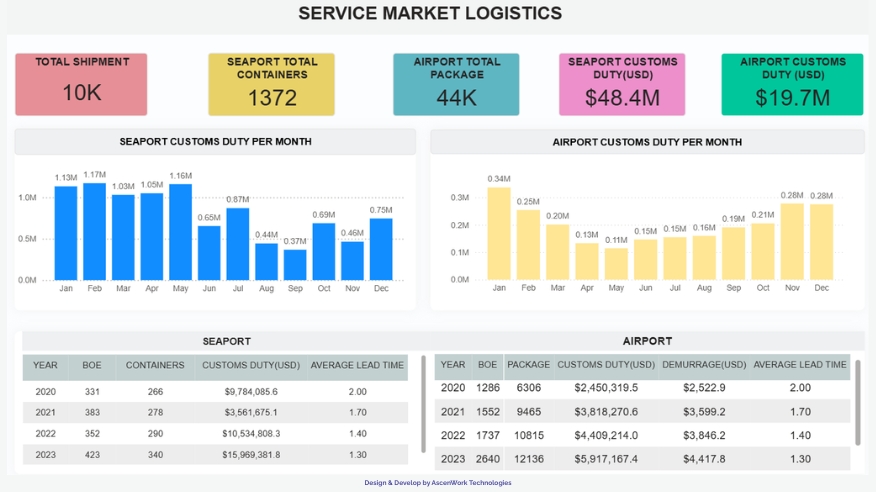
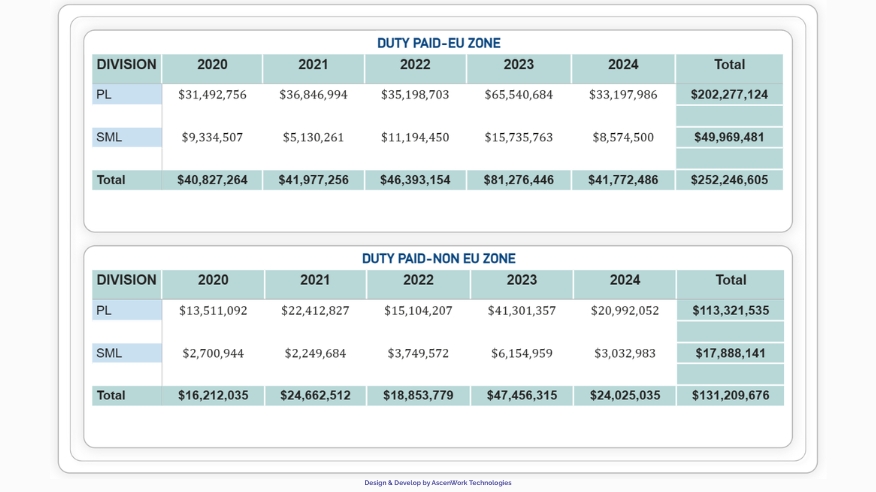
Marketing Dashboard Templates
Track marketing KPIs: campaign ROI, website traffic, lead generation. Visuals might include funnel charts, geographic maps of customer locations, and multi-channel performance
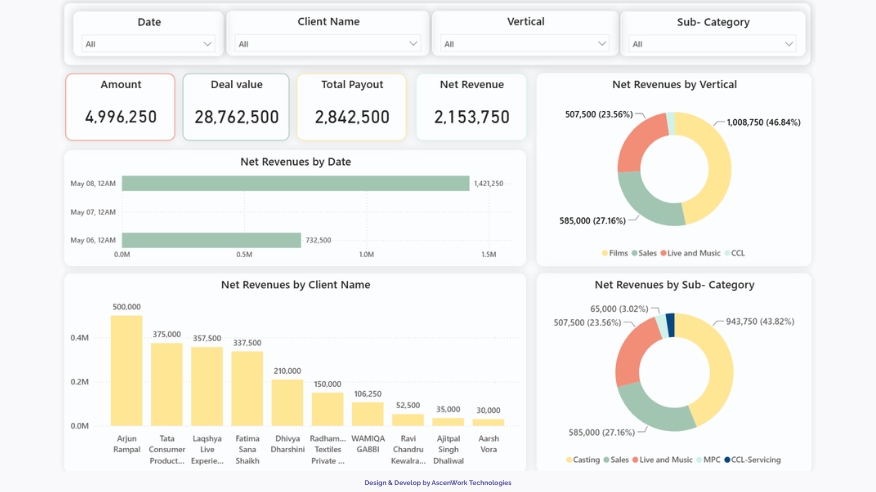
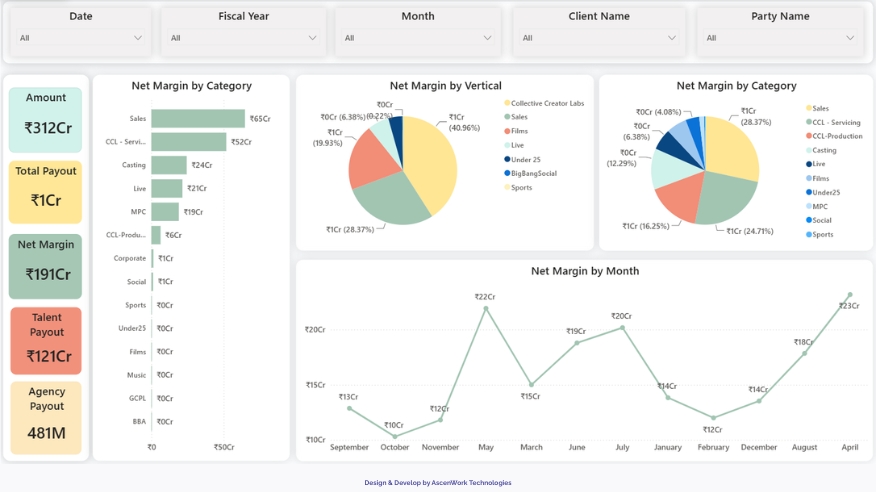
HR Dashboard Templates
Employee and recruitment analytics: headcount, turnover rate, diversity stats. Includes staff distribution charts and hiring funnel visuals. Useful for HR management.
Project Dashboard Templates
Project management visualizations: timelines (Gantt charts), milestone trackers, budget vs actual. Also shows resource allocation and task completion rates.
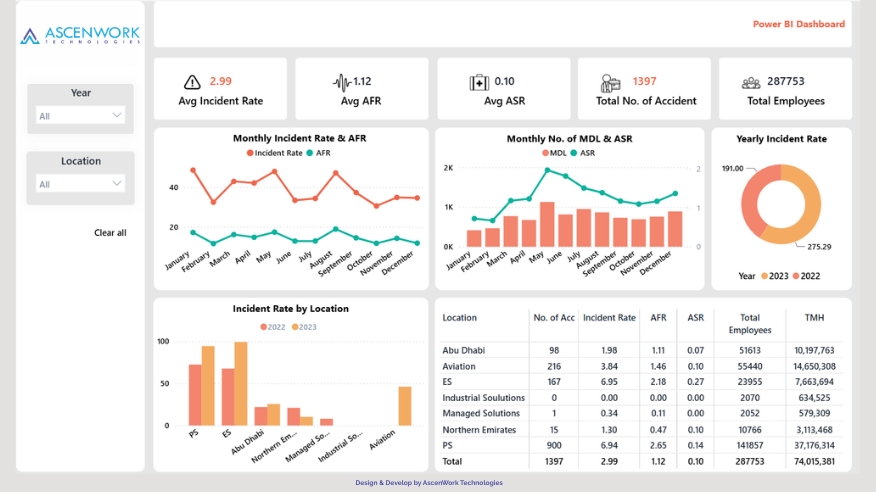
Manufacturing Dashboard Templates
Production insights: output per shift, defect rates, machine utilization. Often includes real-time tracking of manufacturing KPIs like OEE.
Healthcare Dashboard Templates
For hospitals and clinics: patient admissions, capacity, treatment outcomes. Visuals include patient flow, wait times, and departmental costs.
Retail Dashboard Templates
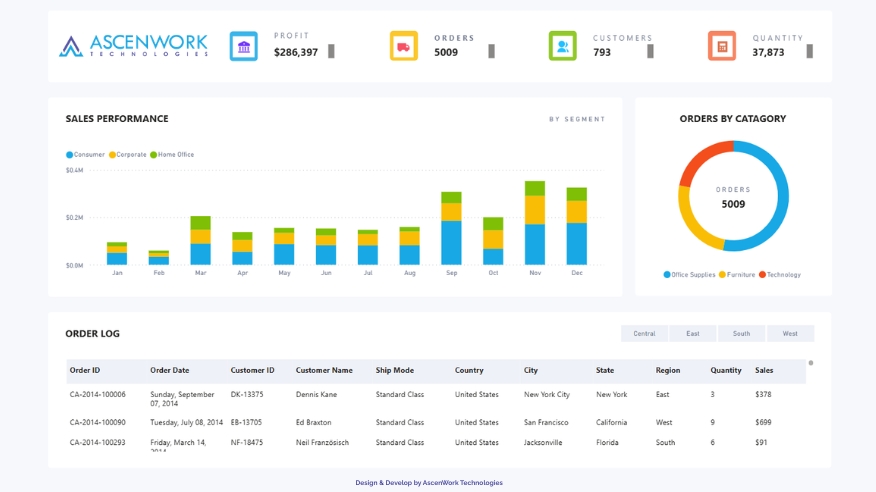
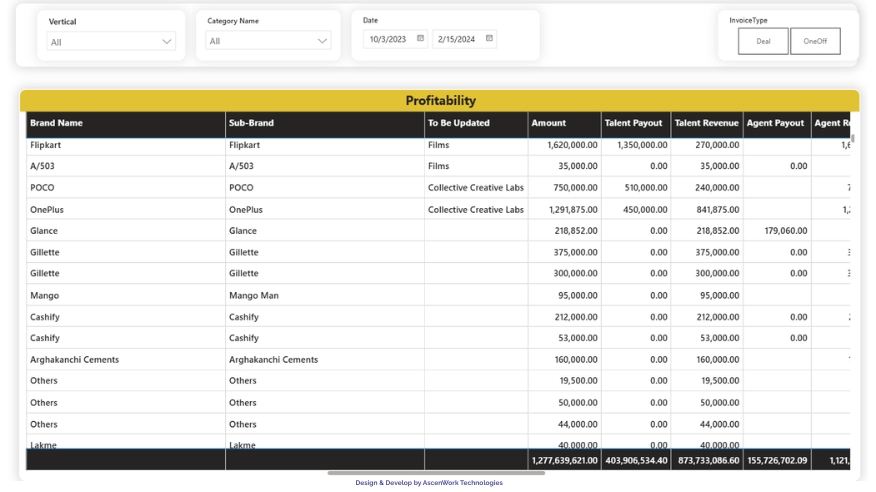
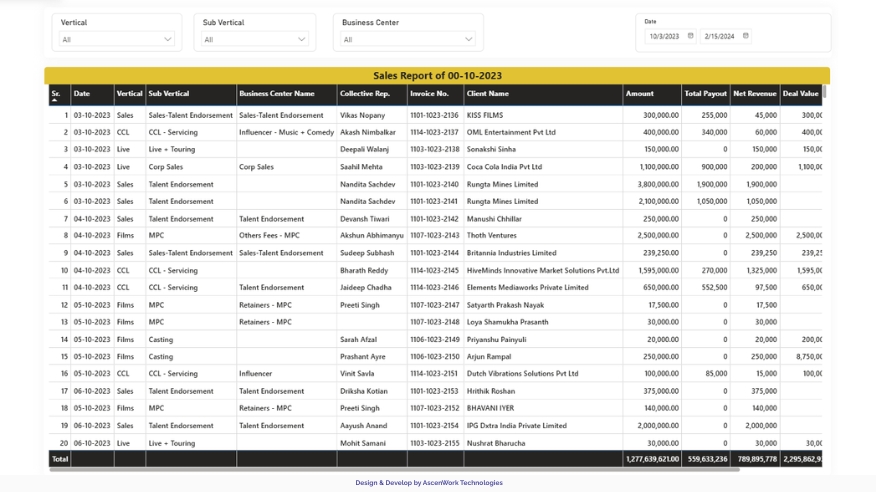
Monitor sales across stores and online channels: units sold, inventory levels, revenue by category. Charts include store comparisons and e-commerce trends.
Inventory Dashboard Templates
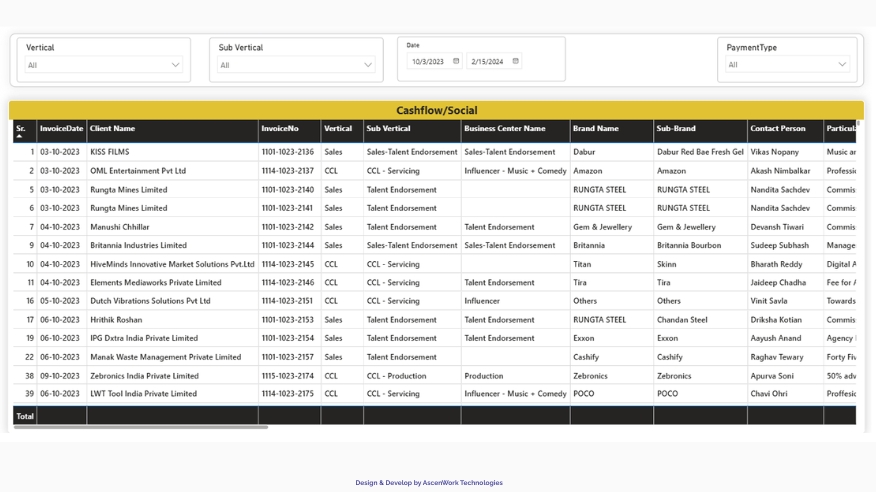
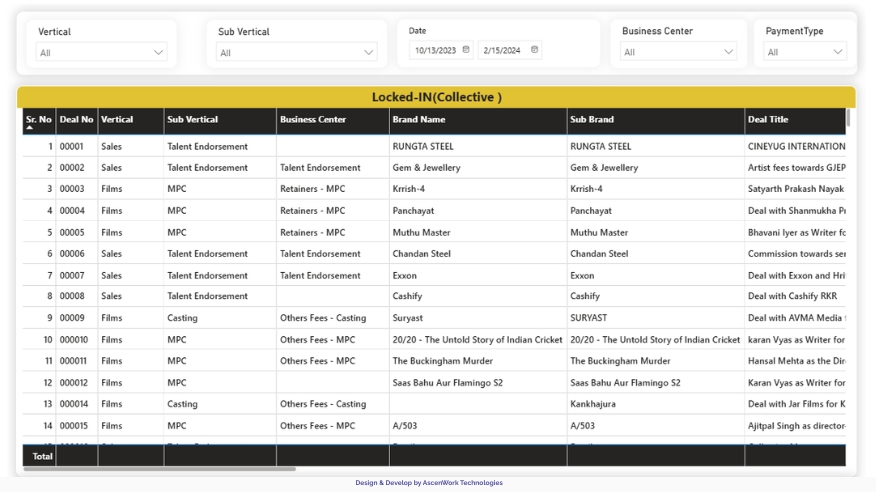
Stock and supply chain metrics: inventory turnover, stockouts, reorder alerts. Features tables of SKU status and trend charts for inventory levels over time.
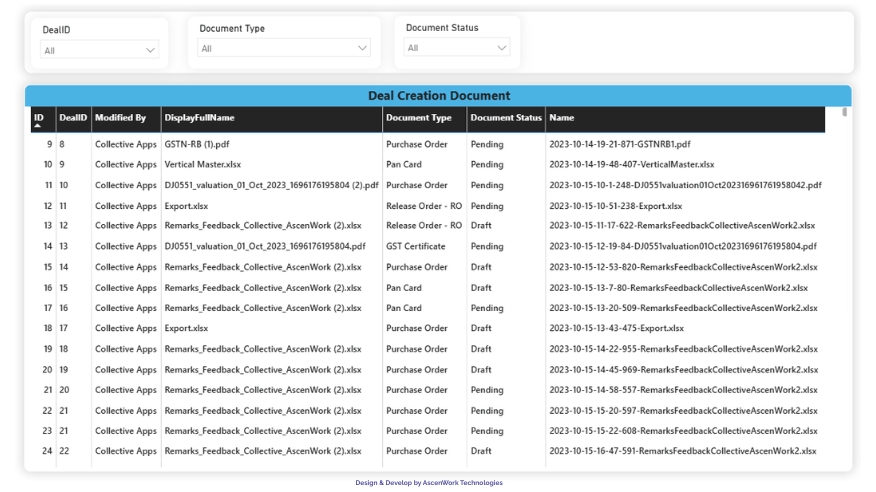
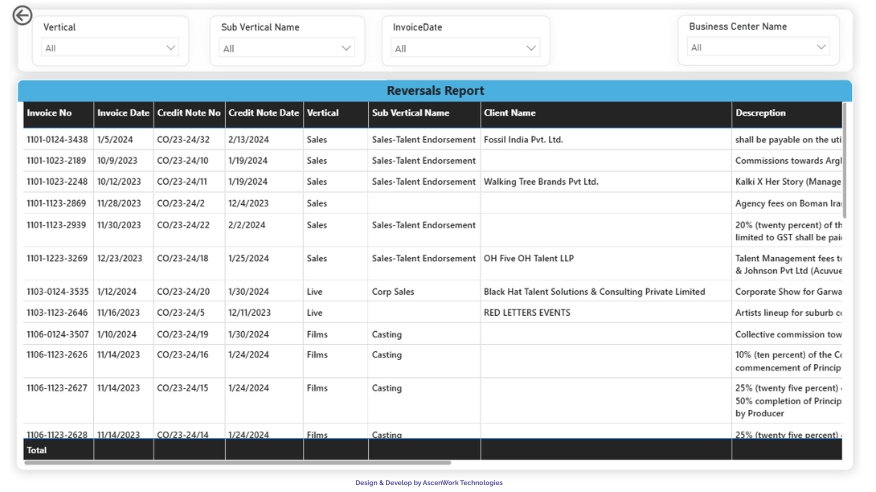
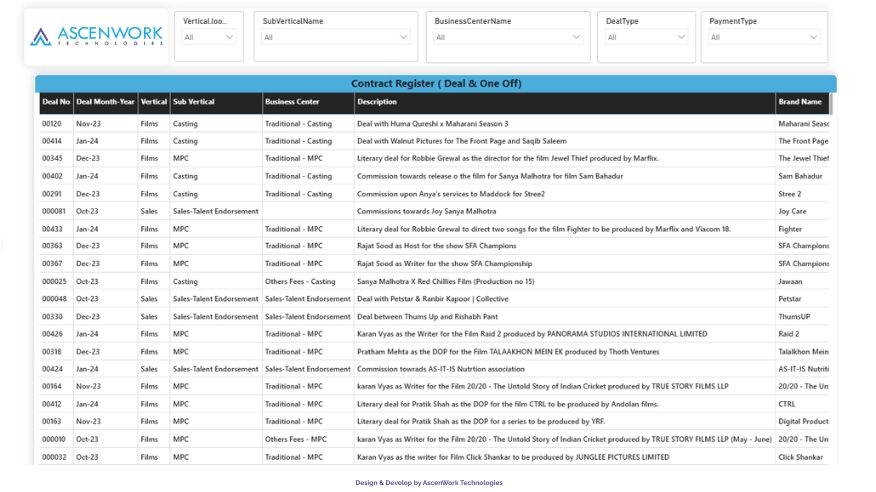
Experience a modern SharePoint design tailored to your business needs. Schedule a personalized demo with our experts today!
Power BI Dashboard Examples
View sample dashboards built with Power BI. Click any example to download the PBIX template and see how we visualized data for that scenario.
Sales Performance Dashboard
Shows monthly revenue vs. target, sales by region, and top-selling products. Includes filters for date range and product category.
Executive KPI Dashboard
High-level overview of business health: total sales, profit margin, and customer satisfaction. Includes trend lines & number cards.
Financial Analysis Dashboard
Visualizes profit and loss, cash flow, and budget vs. actual comparisons. Charts include waterfall for expenses and pie chart for cost breakdown.
Marketing Insights Dashboard
Integrates web analytics and ad performance: displays campaign ROI, website visits, and lead generation. Features funnel and geographic maps.
Benefits of Using Power BI Dashboard Templates
Save Development Time
Proven Best Practices
Consistency & Accuracy
Focus on Insights
Customizable & Scalable
Cost-Effective
Features of Our Power BI Dashboard Templates
One template. Six superpowers, Every Power BI Dashboard Template ships with these features built in – no add-ons, no extra setup needed.
Power BI Template Case Studies
See how AscenWork’s Power BI dashboard templates helped organizations improve reporting speed, increase visibility into operations, and make data-driven decisions across industries. From manufacturing and retail to healthcare and finance, our pre-built Power BI templates have delivered measurable business outcomes.
Manufacturing Client Increased Efficiency by 73%
AscenWork implemented a Manufacturing Power BI Dashboard Template integrating production systems and quality control data. The dashboard provided visibility into OEE.
Retail Chain Improved Sales Visibility Across 50 Stores
The Retail Sales Dashboard Template consolidated POS and inventory data into interactive Power BI reports featuring sales trends, stock alerts, and top-performing products.
Healthcare Provider Enhanced Patient Reporting
AscenWork deployed a Healthcare Analytics Dashboard Template combining patient management and operational data into a centralized reporting platform.
Financial Services Firm Accelerated Executive Reporting
The Financial KPI Dashboard Template automated reporting across revenue, expenses, profitability, and client portfolio performance.
Logistics Company Improved Supply Chain Visibility
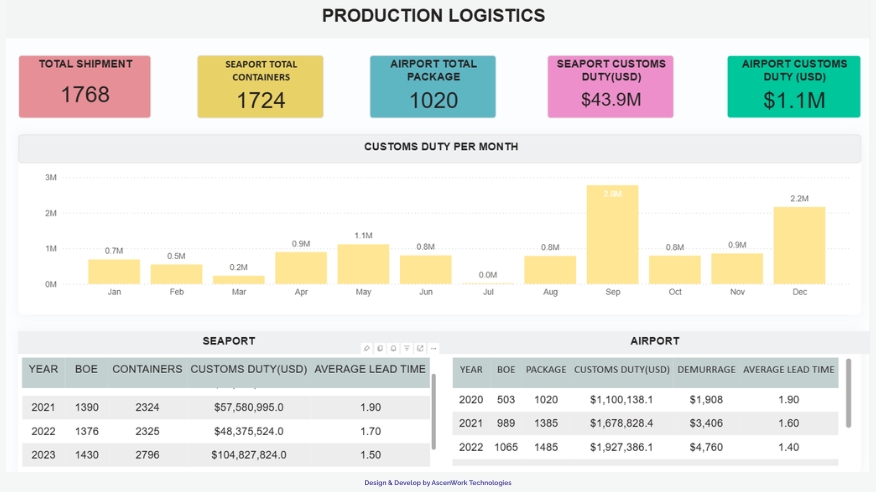
AscenWork implemented a Logistics Dashboard Template integrating transportation and warehouse management systems.
HR Department Streamlined Workforce Analytics
The HR Analytics Dashboard Template provided real-time workforce insights, recruitment tracking, and employee performance reporting.
Education
Logistics
Healthcare
E-commerce
Social network
Media and entertainment
Have a question? check these answers.
A Power BI dashboard template is a pre-built Power BI report (PBIX file) containing visuals, data models, and calculations. It allows you to load your own data and instantly have a working dashboard layout, saving design time.
Download the PBIX file and open it in Power BI Desktop. Then connect it to your own data sources (Excel, SQL, etc.) and refresh. The charts and metrics will update with your data.
Yes. All our templates are fully editable. You can change colors, add or remove visuals, and modify the data model or DAX formulas to suit your needs.
We offer a mix of free and premium templates. Free templates can be downloaded immediately. Premium templates may require signup or a small fee. Check each template’s description.
Templates are provided as Power BI Desktop PBIX files. You will need Power BI Desktop (free) to open them. Some may also be available as Power BI template files (.pbit).
No, you need only Power BI Desktop (free) to open a PBIX file. However, to publish dashboards to the Power BI Service or share them, a Pro or Premium license is required.
Our template library includes dashboards for Sales, Finance, HR, Marketing, Manufacturing, Healthcare, Retail, and more. See the “Industries We Serve” section above.
Absolutely. Each template contains sample data connections. You can edit the “Data Source” settings in Power BI Desktop to point to your own data (Excel, database, etc.) and refresh the visuals.
Using templates saves development time and ensures consistency. They provide best-practice KPIs and layouts so you can focus on analysis. Templates also help teams standardize reporting across projects.
Yes. We provide documentation and video guides on how to customize and deploy our templates.
Yes. Templates are meant for team use. Simply share the PBIX file with colleagues who have Power BI Desktop. You can also publish shared reports in the Power BI Service.
We offer email support for our templates. For premium templates or customization help, consider our consulting services.
We continually expand our library. Check back monthly or subscribe to our newsletter for updates when new templates are released.
After connecting the template to your data, use Power BI’s scheduled refresh in the Power BI Service. This will automatically pull updated data at set intervals.
Yes. Many of our templates use multiple queries (for example, sales data and CRM data). You can merge or append tables within Power Query in Power BI Desktop.
Standard Power BI visuals (bar, line, pie charts, etc.) are included. Some templates also use advanced visuals like gauges, maps, and custom visuals available in Power BI.
We include sample DAX measures in the templates. Comments or documentation can be added per company. (If needed, link to a DAX guide.)
Yes. Many consultants use our templates as starting points for client projects. You can remove our branding (if any) and incorporate them into your deliverables.
Contact us via our Contact page or support email. We welcome suggestions for new templates or improvements.
We encourage users to update visuals as needed. If you encounter an outdated feature, contact us. We periodically update our templates and will provide new versions.