Sales and marketing teams need more than static spreadsheets to understand revenue, pipeline performance, conversions, and campaign results. This Power BI sales dashboard template gives you a ready-made starting point for analyzing sales performance with interactive visuals, KPIs, filters, and sample data. Download the free PBIX template, open it in Power BI Desktop, and customize the report with your own sales or marketing data. You can adapt the visuals and metrics for revenue tracking, sales pipelines, regional performance, product analysis, forecasting, and campaign reporting.
With this template, you can:
- Analyze revenue, sales targets, and growth trends
- Monitor pipeline stages, conversions, and win rates
- Compare sales performance by product, region, and sales team
- Review marketing spend, campaign performance, and ROI
- Start with sample data before connecting your own data sources
Get the Free Power BI Sales Dashboard PBIX
Sales and marketing data is often spread across CRM platforms, Excel files, advertising platforms, and ERP systems. This makes it difficult to get a consistent view of revenue, pipeline health, conversions, and campaign performance. A Power BI sales dashboard template provides a structured starting point for bringing these metrics into one interactive report. Instead of designing every visual and KPI from scratch, teams can begin with a proven dashboard layout and customize it around their reporting requirements.
Key benefits
- Faster reporting: Start with pre-built visuals and KPI layouts instead of building every report element from scratch.
- Better sales visibility: Monitor revenue, pipeline stages, targets, conversions, and product performance in one place.
- Flexible analysis: Explore results by date, region, product, customer, campaign, or sales representative.
- Easier decision-making: Compare actual results with targets and quickly identify performance trends that need attention.
- Reusable reporting structure: Adapt the dashboard framework for different teams, business units, or reporting periods
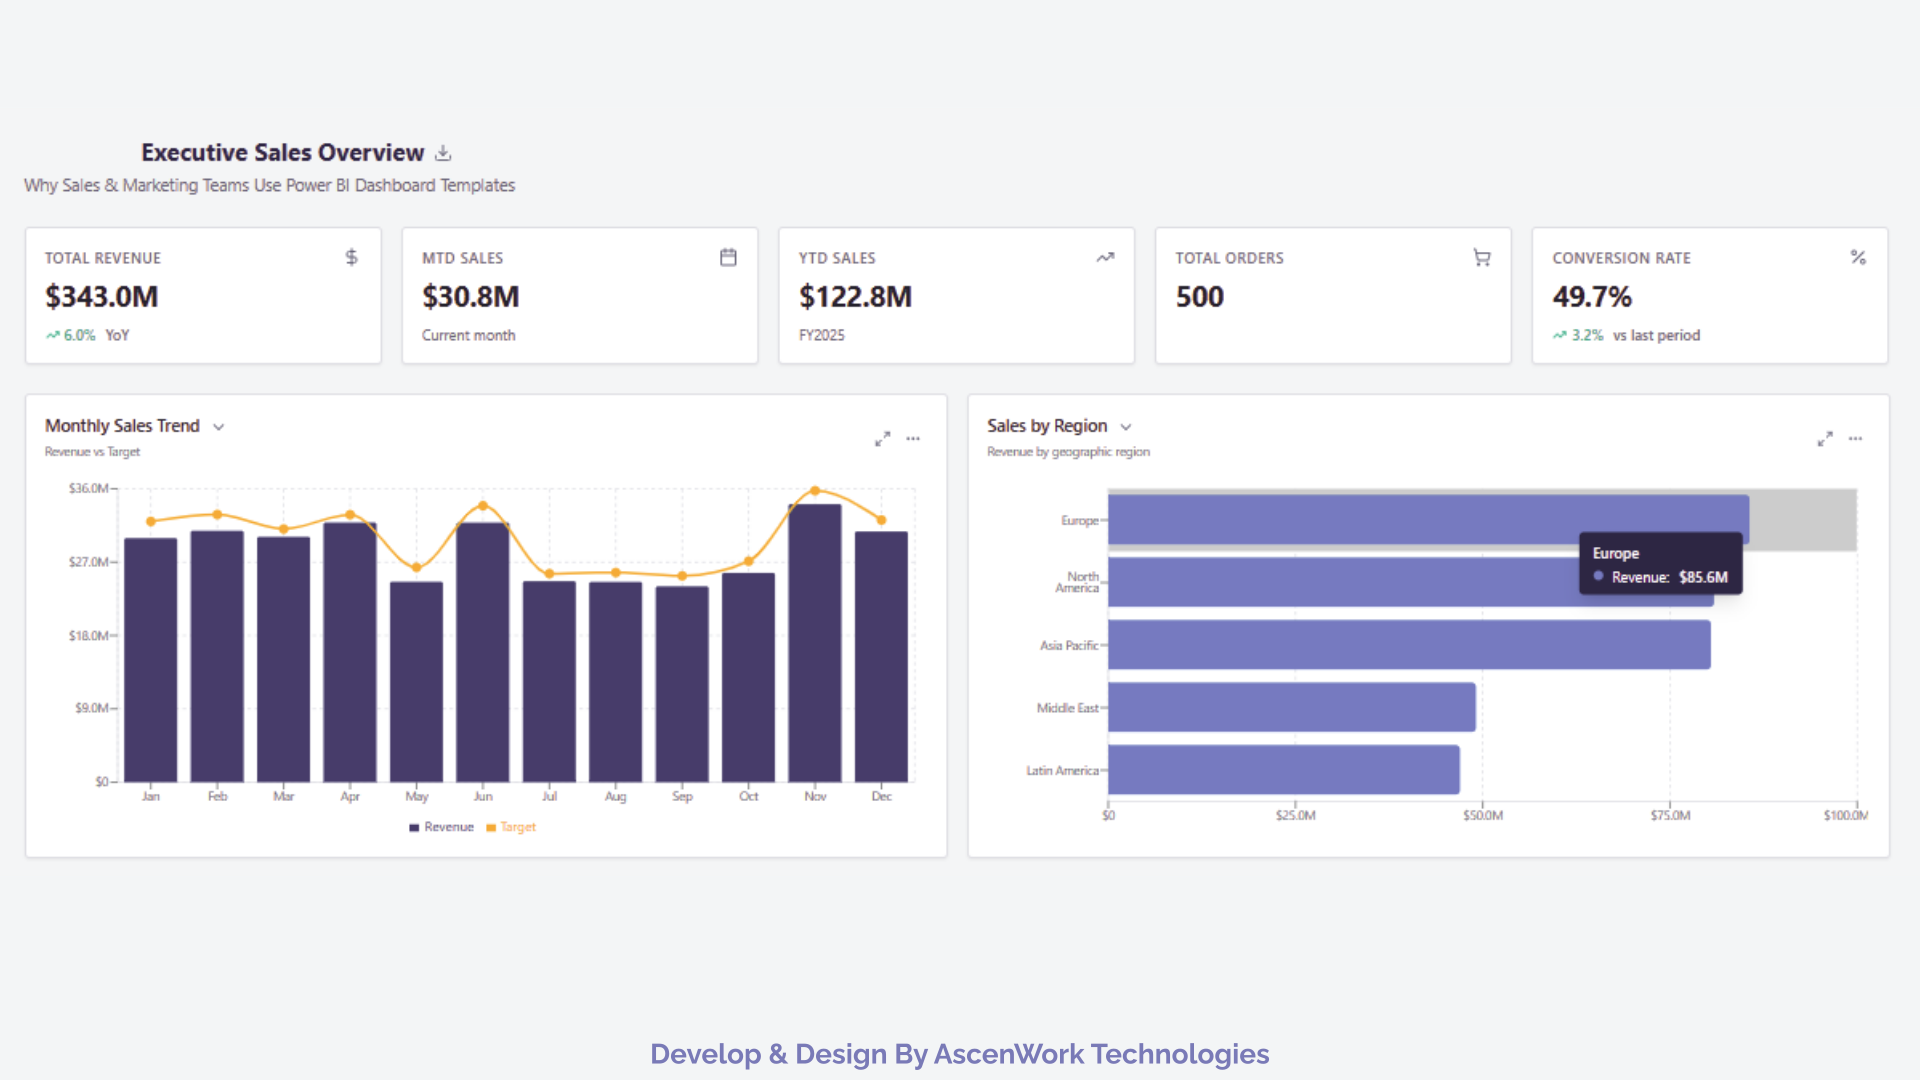
A useful sales dashboard should focus on KPIs that help sales leaders understand revenue performance, pipeline health, customer conversion, and team productivity. This Power BI sales dashboard template includes a practical set of metrics that can be adapted to different sales models.
Core sales KPIs
- Total sales and revenue: Track overall sales value and revenue growth over time.
- Sales targets: Compare actual revenue against monthly, quarterly, or annual targets.
- Sales pipeline: Monitor opportunity value and the movement of deals through each pipeline stage.
- Conversion rate: Measure how effectively leads or opportunities become customers.
- Win rate: Identify the percentage of opportunities that result in closed-won deals.
- Sales trends: Compare monthly and quarterly performance to identify growth or decline.
- Regional performance: Compare revenue and sales results across territories or markets.
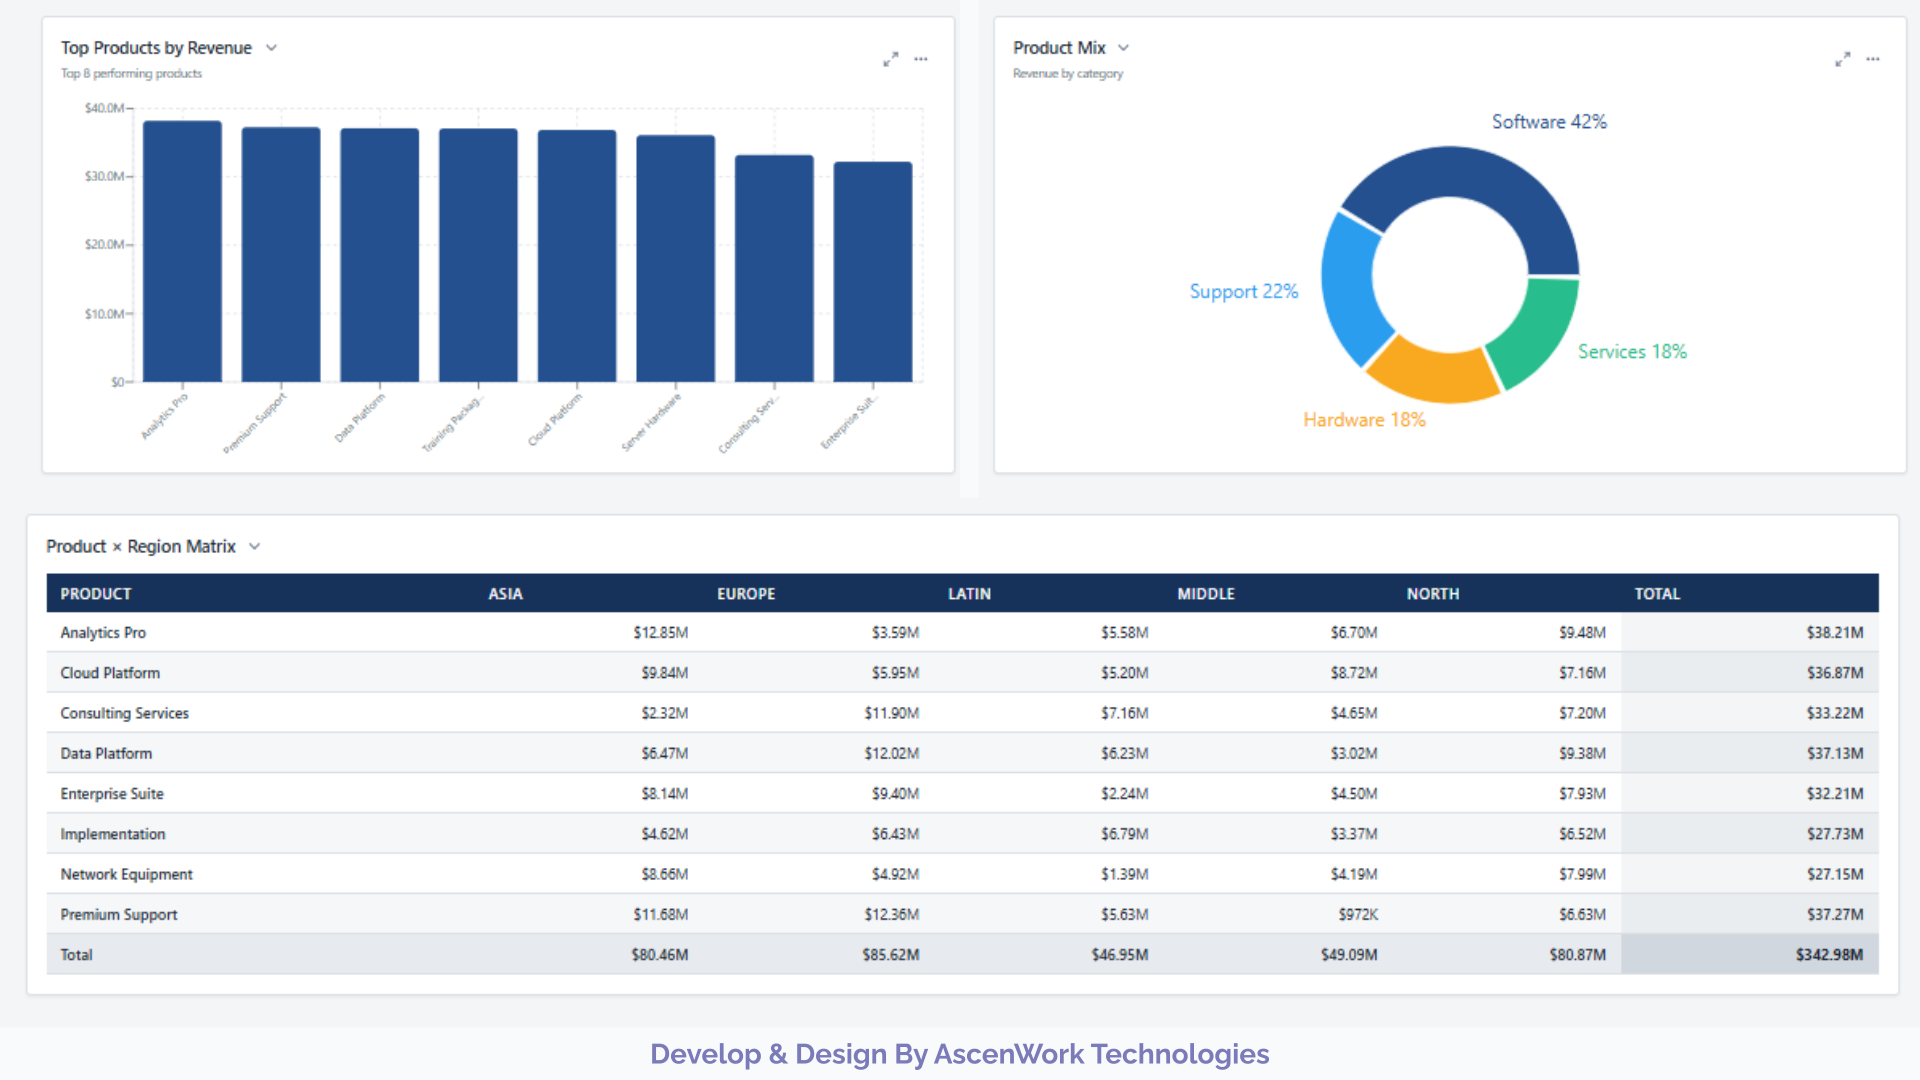
- Product performance: Identify products or services generating the highest revenue.
- Sales representative performance: Compare individual and team-level results.
- Customer acquisition cost (CAC): Evaluate the cost required to acquire customers when marketing and acquisition data is available.
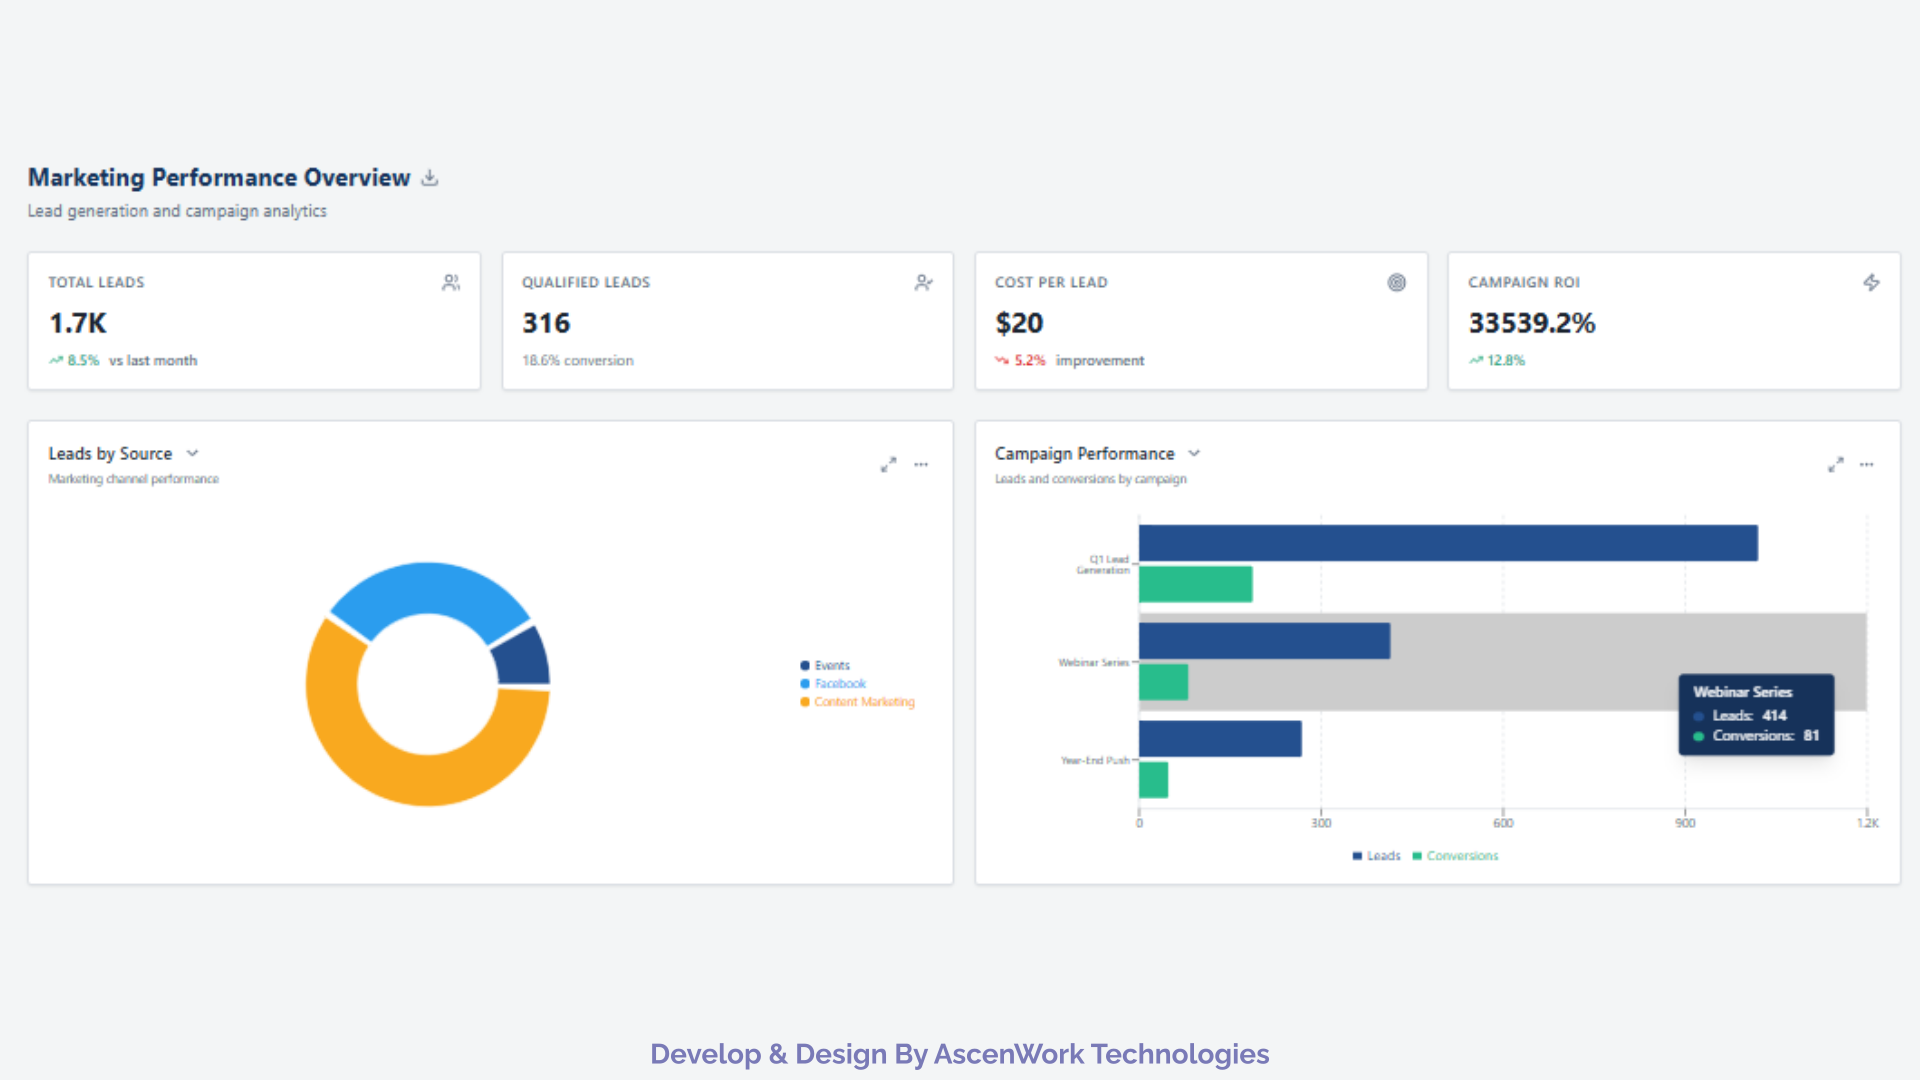
- Campaign ROI: Compare marketing investment with resulting leads, conversions, or revenue.
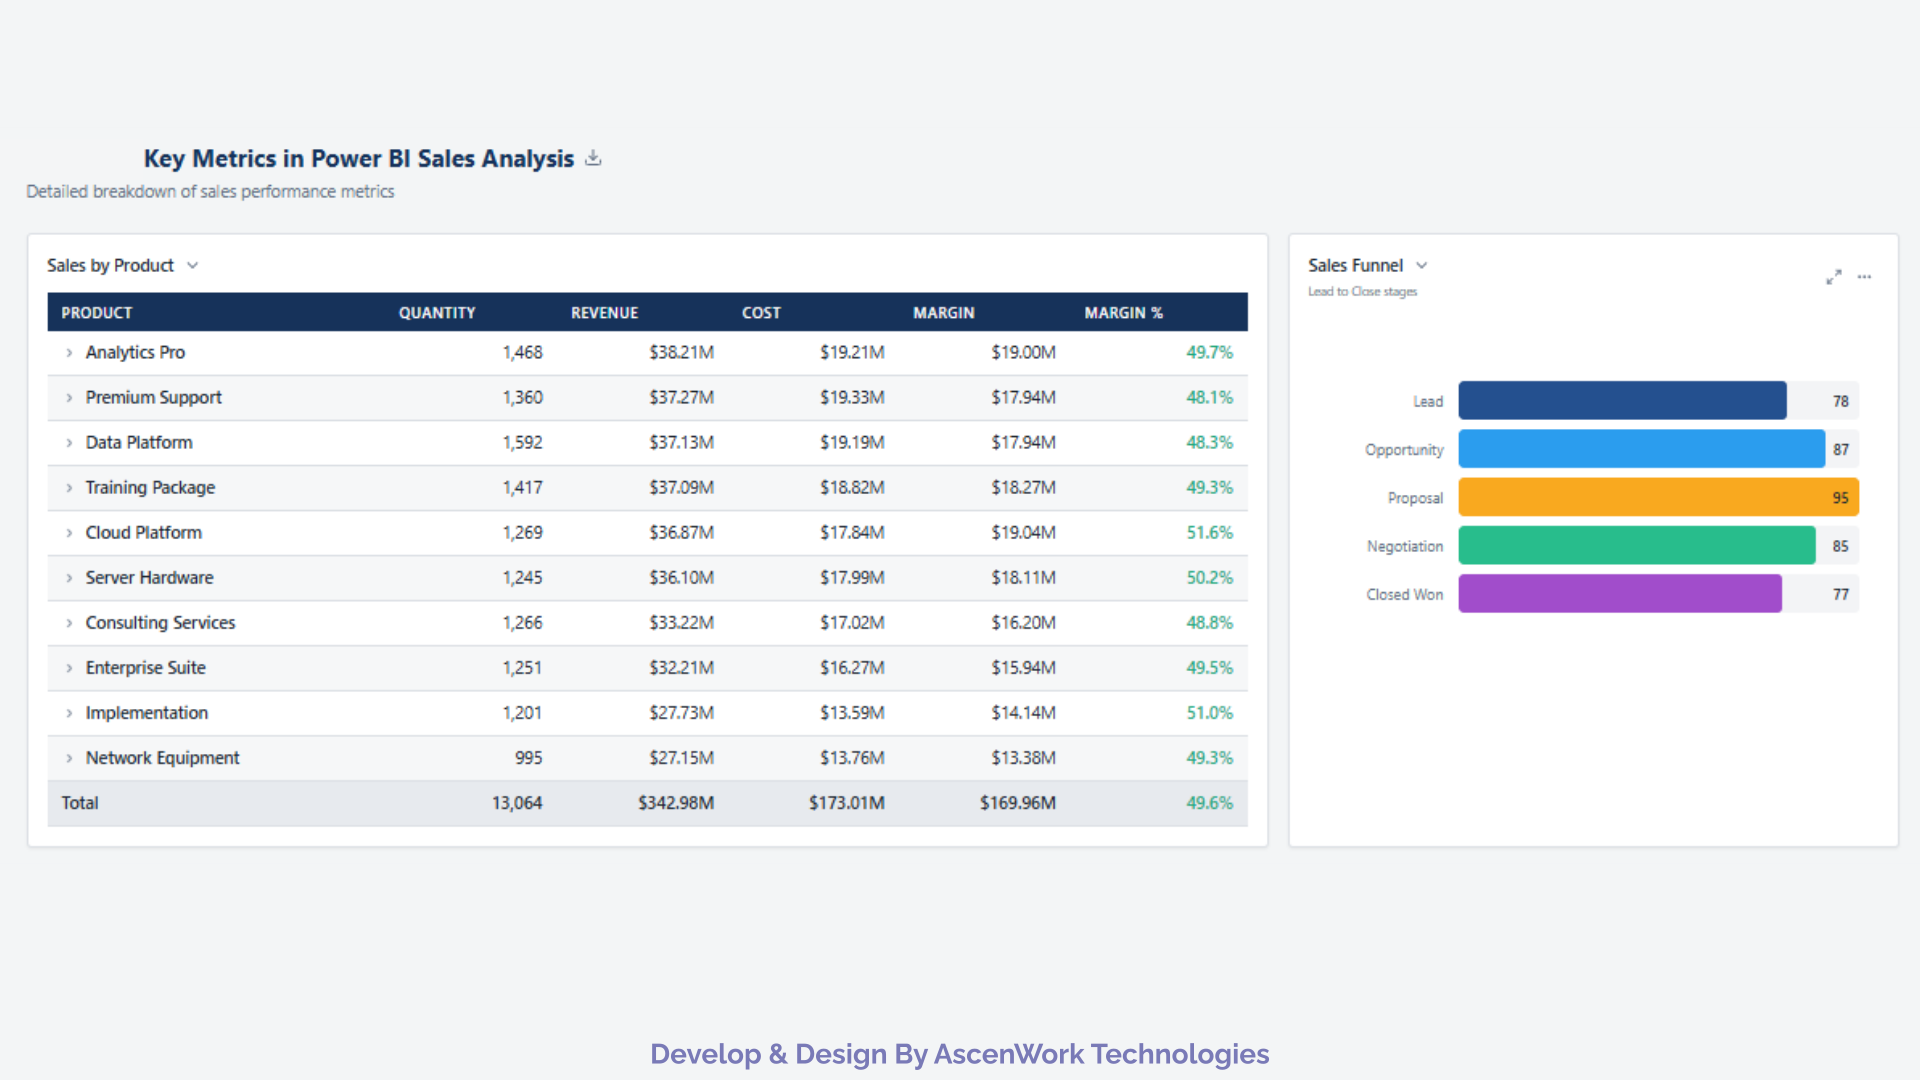
This section showcases Power BI sales dashboard examples using sample data designed around common sales and marketing use cases. These are more than empty layouts: they include visuals, KPIs, and sample data so you can understand how the reports are structured before connecting your own data. Each dashboard uses a clean layout and practical visual structure so you can see how sales and marketing data can be presented in an executive-friendly report.
Examples included in the dashboard:
-
Power BI sales dashboard
-
Sales analysis dashboard Power BI template
-
Sales report template Power BI
-
Marketing performance and campaign dashboard
-
Lead funnel and conversion tracking dashboard
-
Revenue forecasting and trend analysis dashboard
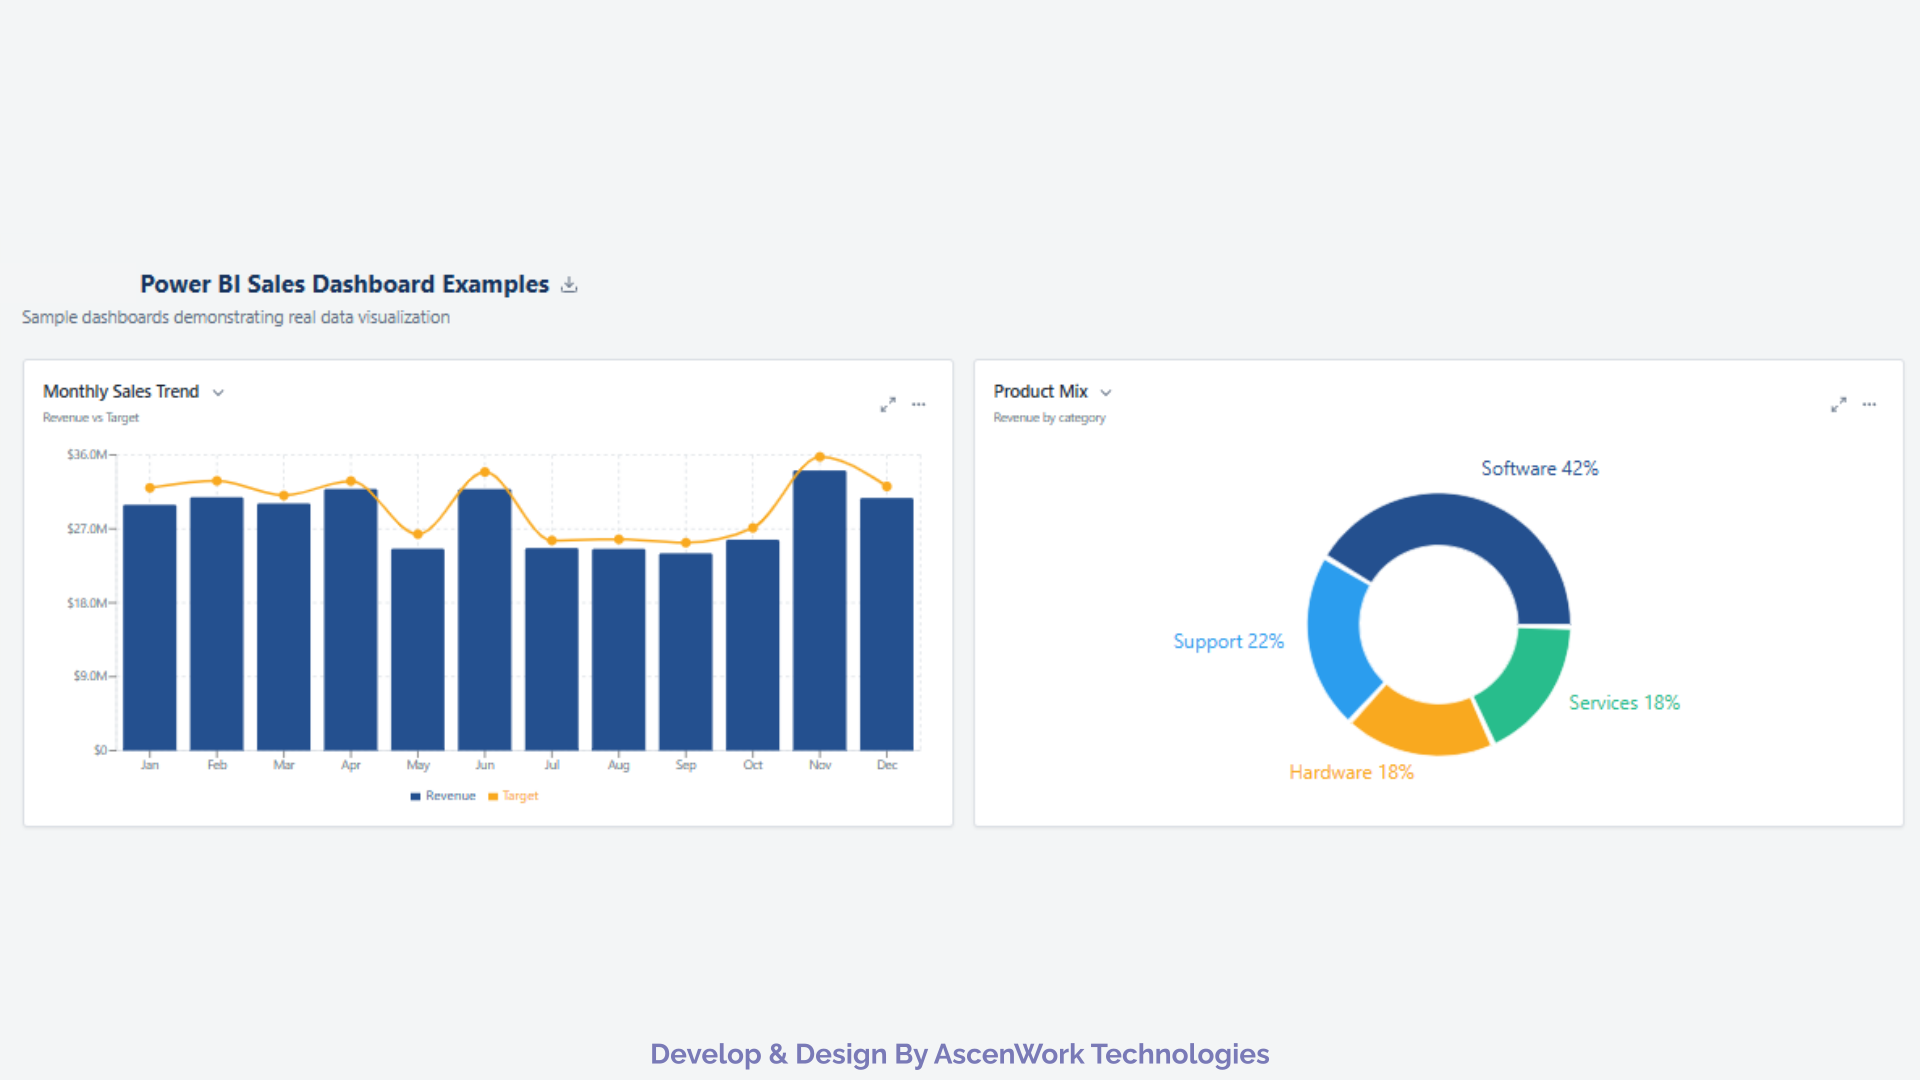
The template provides a starting point for building a structured sales reporting solution in Power BI. The exact visuals and measures can be adapted to your organization’s sales process and available data.
Included dashboard components
- Revenue and sales performance KPIs
- Sales target and actual comparisons
- Monthly and quarterly sales trends
- Sales pipeline and funnel analysis
- Product and regional performance
- Sales representative performance
- Marketing campaign metrics
- Sample data for testing and exploration
- Interactive filters and report visuals
- Editable report layout for customization
The PBIX format allows you to open the report in Power BI Desktop and modify the report structure, visuals, data connections, and calculations according to your requirements.
Use the free Power BI sales dashboard template to explore a ready-made sales reporting layout with sample data and commonly used sales KPIs.
What’s included
- Sales performance KPIs
- Revenue and target tracking
- Monthly sales trend analysis
- Product and regional performance
- Sales pipeline and funnel views
- Sample sales data
- Interactive filters and visuals
- Editable Power BI report layout
File format: PBIX
Designed for: Power BI Desktop
Best for: Sales teams, sales managers, business analysts, BI teams, and organizations evaluating a sales reporting dashboard.
Once you receive the PBIX file, you can open it in Power BI Desktop and adapt the report to your own sales data.
Step 1: Open the PBIX file
Download the template and open the .pbix file using Power BI Desktop.
Step 2: Review the sample report
Explore the existing KPIs, charts, tables, filters, and report pages to understand how the dashboard is structured.
Step 3: Connect your data
Replace or extend the sample data connections with your Excel files, CRM, SQL database, ERP, or other supported data sources.
Step 4: Update the data model
Review relationships, fields, calculated measures, and transformations so the report matches your organization’s data structure.
Step 5: Customize the dashboard
Update visuals, filters, titles, branding, KPIs, and layouts to match your sales reporting requirements.
Step 6: Publish and refresh
When the report is ready, publish it to the Power BI service if you need centralized sharing, collaboration, or scheduled data refresh.
Sales and marketing teams can use the dashboard to monitor performance at different stages of the customer and revenue journey. The same reporting framework can be adapted for operational reviews, management reporting, and executive analysis.
Common use cases:
- Sales performance tracking: Monitor revenue, targets, growth, and sales trends by period.
- Pipeline analysis: Track opportunities by stage, value, probability, and expected close date.
- Sales funnel analysis: Identify where leads or opportunities are being lost during the sales process.
- Regional sales analysis: Compare territories, markets, or locations to identify high- and low-performing regions.
- Product performance: Analyze revenue, quantity sold, margins, and product-level contribution.
- Sales team performance: Compare sales representatives and teams against targets and historical results.
- Marketing campaign analysis: Measure campaign spend, leads, conversions, and ROI.
- Revenue forecasting: Compare forecasted revenue with actual sales and identify potential gaps.
- Executive reporting: Present a concise view of revenue, pipeline, targets, and business performance for leadership.
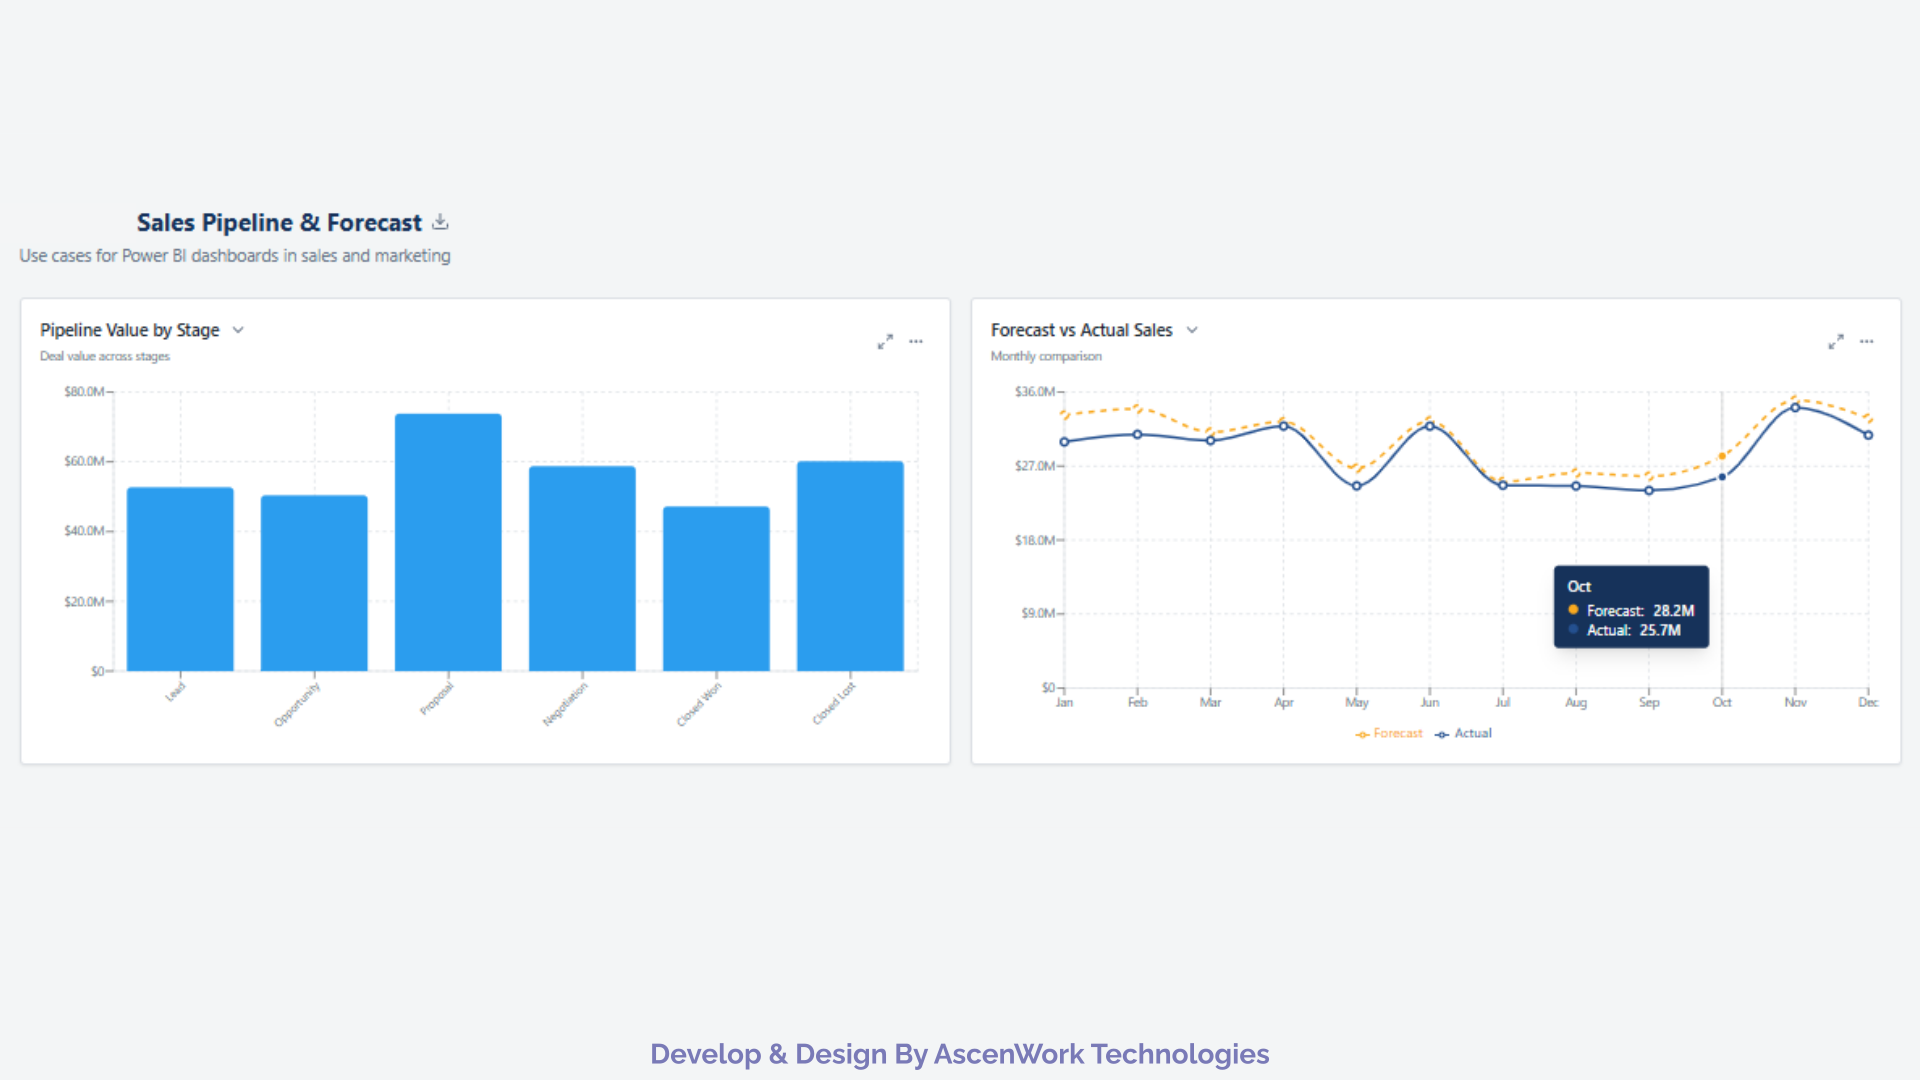
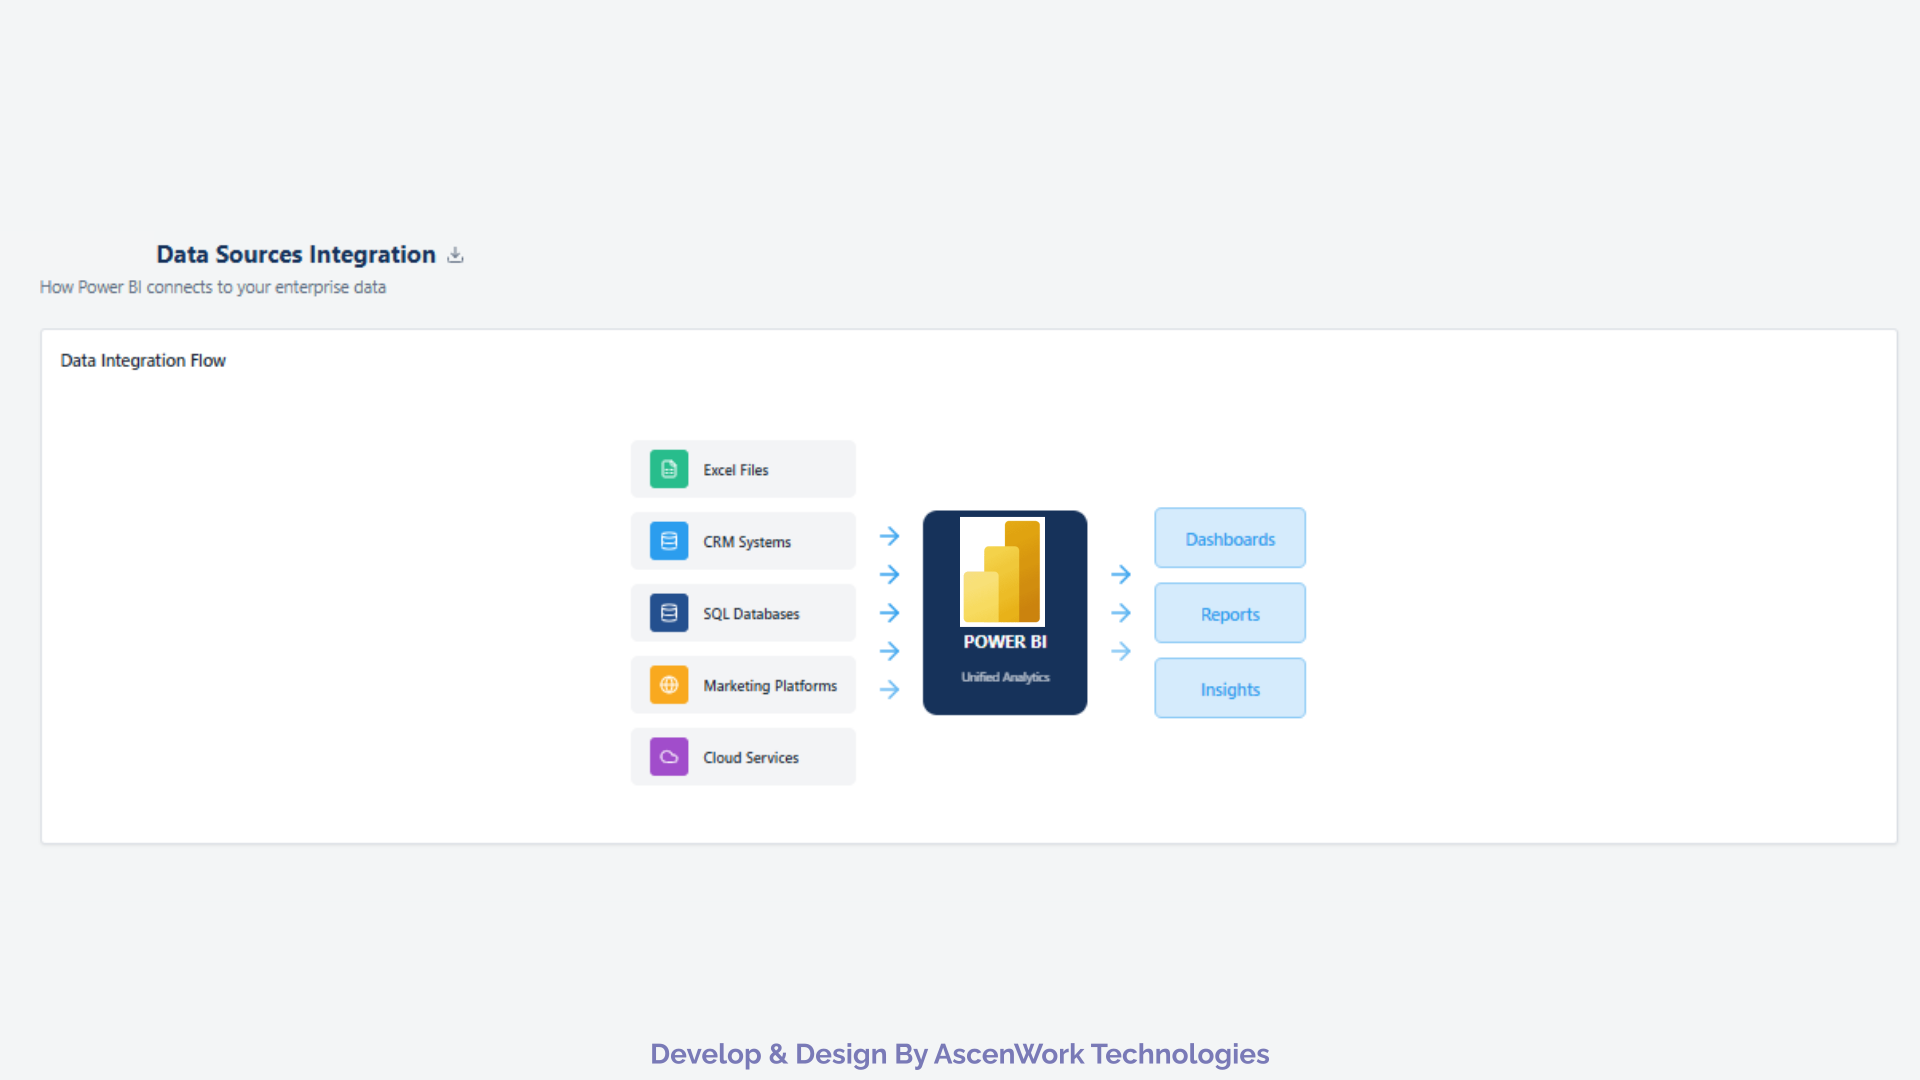
The Power BI sales dashboard template can be adapted to common sales and marketing data sources. The exact connection method and transformation requirements depend on how your source data is structured.
Common data sources
- Excel and CSV files for sales transactions, targets, customer lists, and product data
- CRM platforms such as Microsoft Dynamics 365, Salesforce, and Zoho CRM
- SQL Server and Azure SQL for centralized sales and customer databases
- Marketing platforms such as Google Ads and other campaign data sources
- ERP and accounting systems for revenue, orders, customers, and financial information
You can start with the sample data included in the dashboard and later replace or extend the data model with your own sources. Power BI Desktop supports report development, data transformation, modeling, and visualization before the report is published to the Power BI service.
A sales dashboard template is most useful when it gives your team a practical reporting structure rather than simply adding attractive charts to a blank report. Our Power BI sales dashboard templates are designed around commonly used sales and marketing KPIs, with layouts that can be adapted to different reporting requirements.
What you get
- Ready-made PBIX report structure
- Sales and marketing KPI layouts
- Sample data for exploring the dashboard
- Interactive visuals and filters
- Revenue, pipeline, conversion, and performance analysis
- Flexible layouts for management and operational reporting
- Customization options for your own data and branding
- Support for connecting the report to business data sources
Download the Free Template or Build a Custom Sales Dashboard
Get the template to explore the reporting structure. Choose a custom dashboard when you need your own KPIs, data model, integrations, branding, and automated reporting.
Get the Free PBIX Template
Frequently Asked Questions About Power BI Sales Dashboard Templates
Yes, the template is available as a free PBIX download/request. Use the download form on this page to request the available template.
The template includes sales KPIs, visualizations, filters, sample data, and a report structure that can be adapted for sales and marketing reporting.
Yes. You can replace or extend the sample data with sources such as Excel, CSV, SQL Server, Azure SQL, CRM platforms, ERP systems, or other supported Power BI data sources.
Yes. You can modify visuals, filters, KPIs, branding, data connections, calculations, and report layouts to match your business requirements.
Yes. A PBIX file is a Power BI Desktop report file, so Power BI Desktop is required to open and edit it.
PBIX is the standard Power BI Desktop report file format. PBIT is the Power BI report template format and is designed to store the report structure without the full underlying data.
Yes. The report can be adapted to CRM data from platforms such as Dynamics 365, Salesforce, or Zoho, depending on the available data structure and connector requirements.
Yes. AscenWork can customize the sales dashboard around your KPIs, data sources, reporting process, branding, security requirements, and Power BI deployment environment