With Microsoft bringing generative AI into its flagship analytics platform, many professionals are now asking: what are the benefits of Power BI Copilot, and how can it transform reporting workflows? In this blog, we’ll explore the latest Power BI updates — including Copilot — and break down how these features help IT leaders, CFOs, and business analysts make better decisions, faster.
Need help getting started?
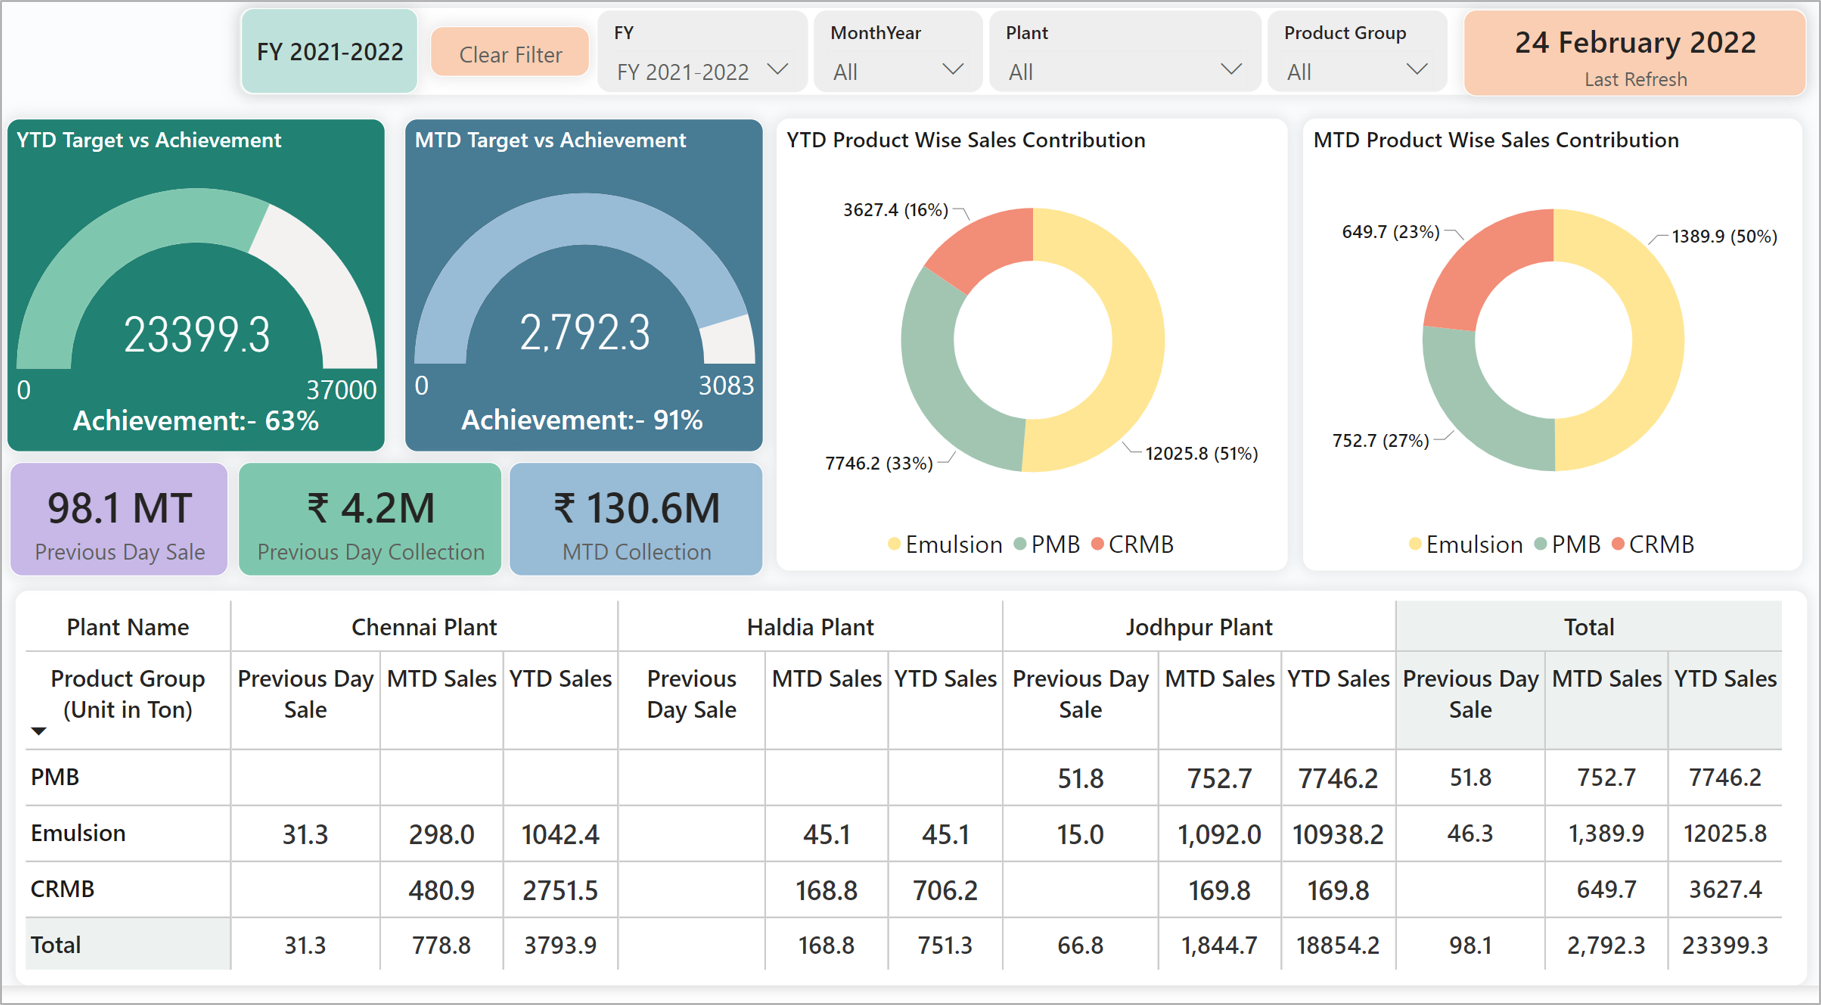
Want to explore Power BI dashboards for your company?Faster Insights
Ask questions like “Summarize sales performance by quarter” and receive instant narratives
AI Report Generation
Generate visuals and DAX calculations without writing code
Enhanced Storytelling
Automatically generate executive summaries for dashboards
Improved Collaboration
Copilot works within Teams, Excel, and other Microsoft 365 tools


Need help activating Copilot for your organization?


Have a question? check these answers.
It’s the process of converting raw data into actionable insights using interactive dashboards, reports, and analytics.
Yes, Copilot can generate text summaries and suggest visuals, but human validation is still recommended.
Copilot can generate visuals for dashboards, but final layout and interactivity should be handled by users.
It’s a text block auto-generated by Copilot explaining data insights from selected visuals or pages.
It’s a dashboard designed for CFOs that tracks metrics like P&L, revenue growth, gross margin, and cash flow trends in real time.
It refers to descriptive statistics: minimum, Q1, median, Q3, and maximum — typically shown in box plots.