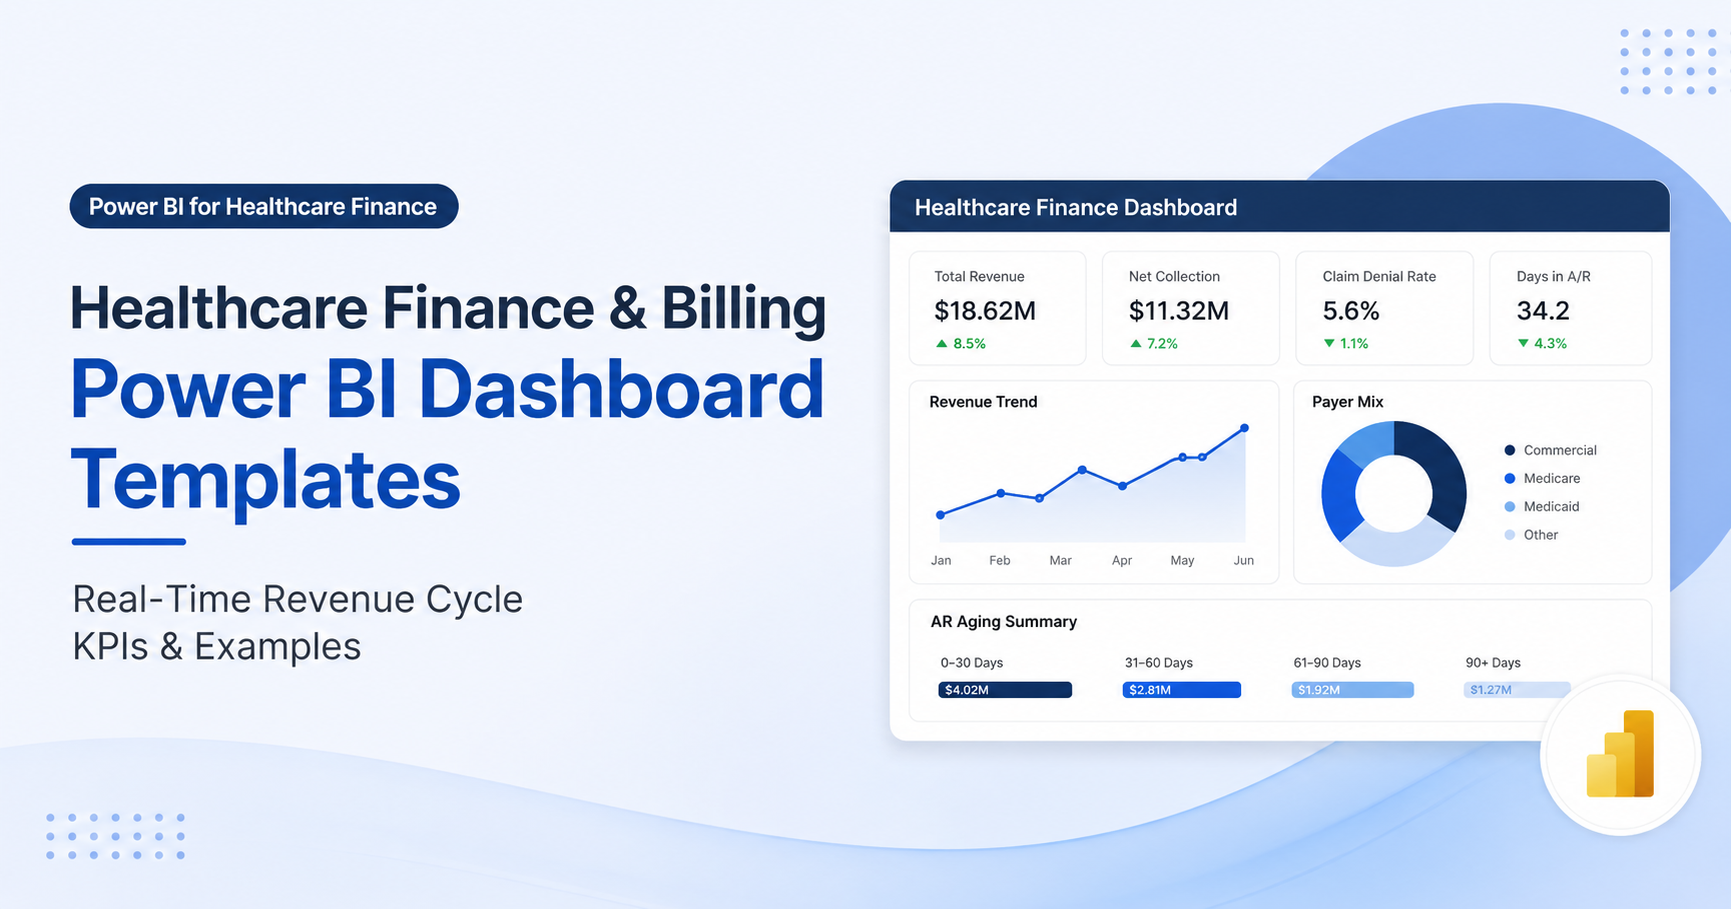
Healthcare Finance & Billing Power BI Dashboard Templates: Real-Time Revenue Cycle KPIs & Examples
Healthcare finance Power BI dashboards transform siloed billing data into actionable intelligence. When revenue cycle managers track claims, denials, and collections manually across spreadsheets, they lose critical visibility into cash flow bottlenecks and compliance risks. A centralized healthcare finance Power BI dashboard consolidates data from EHR, billing, and accounting systems into real-time visualizations that enable faster decision-making, reduce reporting overhead, and improve revenue cycle performance.
Key Takeaway
A well-designed healthcare billing Power BI dashboard unifies claims, revenue, and accounts receivable data into interactive views that eliminate manual reporting, reveal optimization opportunities, and support compliance-ready financial governance.
In This Article
- Why Healthcare Finance Teams Need Real-Time BI Dashboards
- Core Challenges in Healthcare Billing & Revenue Cycle Management
- The Solution: Power BI Healthcare Finance & Billing Dashboards
- Key Healthcare Finance & Billing Dashboard KPIs
- Real-World Healthcare Billing Dashboard Examples
- Healthcare Finance Power BI Dashboard Template Components
- Getting Started with a Healthcare Finance Power BI Dashboard
- Frequently Asked Questions
- Transform Your Revenue Cycle Today
Why Healthcare Finance Teams Need Real-Time BI Dashboards
Healthcare finance Power BI dashboards address a critical industry shift: moving from quarterly reporting to real-time financial monitoring. Healthcare organizations that rely on Excel-based reporting and static month-end snapshots operate in a reactive mode. Sound familiar? By the time finance leaders see last month’s data, claims have already been denied, cash collection has slipped, and opportunities to optimize the revenue cycle have passed.
Industry trends show that healthcare finance teams spend 20 to 30 percent of their time compiling reports from multiple systems instead of analyzing results and driving action. This administrative burden delays insight and increases the risk of reporting errors. On top of that, when billing data lives in silos across the EHR, practice management, billing, and accounting platforms, no single view of revenue cycle truth exists.
Healthcare organizations without real-time visibility report an average Days Sales Outstanding (DSO) of 55 days or higher, compared to industry benchmarks of 40 to 50 days for high-performing organizations. This gap translates directly to delayed cash flow and increased working capital requirements.
Medical Group Management Association (MGMA) Performance & Practices of Successful Medical Groups, 2023
Additionally, initial claim denial rates in healthcare remain stubbornly high. Without visibility into denial patterns and root causes, billing teams can’t prevent future rejections or rework claims efficiently. A healthcare finance Power BI dashboard changes this dynamic by providing real-time visibility into every stage of the revenue cycle.

Core Challenges in Healthcare Billing & Revenue Cycle Management
Healthcare revenue cycle management operates under unique pressures that create bottlenecks and revenue leakage. Understanding these challenges clarifies why a healthcare billing Power BI dashboard is essential infrastructure, not just a nice-to-have reporting tool.
- Fragmented data across multiple systems: EHR, practice management, billing, and accounting platforms operate independently. Consolidating data manually is time-consuming and error-prone, and no single view of claims, revenue, or collections exists in real time.
- Visibility gaps in claims processing: Finance teams can’t quickly determine claim status, identify bottlenecks, or spot denials before they cascade into rework cycles. This delay extends cash collection and increases accounts receivable aging.
- Compliance and audit burden: Healthcare finance requires audit-ready, documented financial records with complete historical data integrity. Manual spreadsheets lack proper version control, access logging, and change tracking.
- KPI blindness across the organization: Without centralized dashboards, different departments operate with different metrics and definitions. Revenue recognition, denial rate calculations, and patient responsibility aging lack consistency, making cross-departmental optimization impossible.
- Manual reporting overhead: Finance teams spend hours each week pulling data, formatting reports, and distributing updates to leadership. This work consumes resources that could be spent on revenue cycle analysis and improvement initiatives.
- Revenue leakage from untracked adjustments: Contractual adjustments, bad debt reserves, and patient responsibility aging fall through cracks when tracking relies on manual processes. This leakage is often not discovered until end-of-quarter close activities.
The consequence is predictable: delayed cash flow, missed optimization opportunities, and finance leaders making decisions based on outdated or incomplete data.
The Solution: Power BI Healthcare Finance & Billing Dashboards
A healthcare finance Power BI dashboard solves these challenges by creating a single source of truth that integrates data from multiple systems and surfaces actionable insights in real time. Rather than waiting for month-end close processes, finance teams see claims, revenue, and collections data update hourly or daily, enabling rapid response to bottlenecks and denial trends.
The right healthcare billing Power BI dashboard approach integrates data from your practice management system, EHR, and accounting platforms into a centralized data model. This unified view enables claims to be tracked from submission through denial or payment, revenue to be recognized by payor and service type, and accounts receivable to be aged and analyzed by guarantor type.
Here’s the thing: a well-designed dashboard automates routine reporting so finance teams shift from data compilation to data analysis. Leadership gains instant visibility into revenue cycle health through interactive visualizations that support drill-down analysis. When a director sees that denial rates spiked last week, they can click through to see which denial codes drove the increase, which departments contributed most claims, and which payors are responsible. This capability enables faster, more informed decisions.
Expert Perspective
A healthcare finance Power BI dashboard isn’t a substitute for strong data governance upstream. Success depends on clean, timely data flowing from your EHR and billing systems. Start by auditing your data sources for accuracy and completeness. Then model your healthcare billing data to establish correct relationships between claims, payments, adjustments, and patient responsibility. This foundation enables dashboards to reveal patterns that manual reporting can’t surface, such as specific payors driving denial rates or departments with unusually high days in accounts receivable.
When selecting a healthcare billing dashboard partner or building internally, prioritize organizations with hands-on experience implementing BI solutions in healthcare settings. Look for expertise in revenue cycle workflows, understanding of HIPAA compliance requirements for dashboard access controls, and track record supporting dashboard maintenance and evolution as business needs change.
Key Healthcare Finance & Billing Dashboard KPIs
Effective healthcare finance Power BI dashboards focus on a core set of revenue cycle KPIs that directly impact cash flow and operational performance. These metrics span claims processing, revenue recognition, collections, and denial management. That said, a comprehensive healthcare billing Power BI dashboard should track all of these dimensions.
Claims Processing Metrics
Track claims from submission through acceptance or denial. Key metrics include total claims submitted by period, claims accepted on first submission (clean claim rate), claims pending response from payors, and claims denied with reason codes. Additionally, monitor claims rework cycles to understand how many times a claim is resubmitted before resolution. This visibility reveals whether specific billing departments or revenue cycle stages are creating bottlenecks.
Revenue Recognition
Monitor revenue by payor type, service line, and encounter type. Worth noting: track contractual adjustments separately from gross charges to understand true realization rates. A healthcare finance Power BI dashboard should show revenue trend lines by payor so finance leaders detect shifts in revenue mix or unexpected patterns. Additionally, aging analysis of outstanding revenue helps identify slow-paying contracts.
Accounts Receivable & Collections
Days Sales Outstanding (DSO) is a primary financial KPI for healthcare organizations. Track DSO trend over time and by payor to spot changes in collection performance. Additionally, segment accounts receivable into aging buckets: current (0-30 days), aging (31-60 days), aged (61-90 days), and very aged (90+ days). Monitor patient responsibility aging separately from insurance responsibility since these require different collection strategies. Moreover, track collection rate percentage (cash collected divided by revenue) and patient payment rate to measure patient responsibility collection effectiveness.
Denial Management
Track denial rate percentage (denied claims divided by total submitted), top denial reason codes, and denial rework time. Additionally, monitor which payors generate highest denial rates and whether specific departments or providers correlate with higher denial volumes. This intelligence enables targeted training and process improvements. Furthermore, measure denial prevention by tracking clean claim rate and first-pass resolution rate trends.
Cash Flow & Working Capital
Monitor cash received by period compared to revenue recognized to surface timing gaps. Additionally, track accounts receivable trend and aging composition to forecast future cash collection. A healthcare finance Power BI dashboard should flag when aged receivables grow faster than current receivables, signaling collection deterioration.
Real-World Healthcare Billing Dashboard Examples
Healthcare organizations across different settings have deployed healthcare finance Power BI dashboards to drive measurable improvements in revenue cycle performance. The following examples illustrate how dashboards translate into operational benefits. Note that these scenarios reflect common use cases without reference to specific organizations.
Multi-Specialty Hospital System Dashboard
A 15-hospital health system with centralized billing operations deployed a healthcare billing Power BI dashboard to monitor inpatient and outpatient revenue, track claims submissions and denials by hospital and department, and measure DSO by payor type. Finance leadership reviews the dashboard daily during revenue cycle huddles. When the dashboard revealed that one hospital’s clean claim rate was 8 percent lower than peer hospitals, the revenue cycle team conducted a coding audit, identified training gaps, and implemented targeted education. Subsequently, that hospital’s clean claim rate improved by 6 percent within two months, reducing rework cycle time and accelerating cash collection.
Revenue Cycle Outsourcing Company Dashboard
A medical billing service center processes claims for over 200 medical practices. The company built a healthcare finance Power BI dashboard to track claims intake volume, submission turnaround time, denial patterns, and collection performance by client account. The dashboard surfaces performance trends so the company can proactively alert clients to denials and rework volumes. Furthermore, dashboards enable the outsourcer to identify whether specific claim types or payors require additional resources or process refinement. Consequently, clients achieve faster cash collection and billing teams operate more efficiently.
Surgical Center Collections Optimization
An ambulatory surgical center faced challenges with patient responsibility collection. The center built a healthcare billing Power BI dashboard to track patient responsibility aging, payment posting delays, and collection effectiveness by guarantor. The dashboard revealed that a significant portion of patient payments were delayed 30 to 60 days due to slow statement posting. The center accelerated posting processes, and the dashboard confirmed improvement within one billing cycle. Additionally, the dashboard showed which patients had outstanding balances aged 90+ days, enabling focused collection efforts that recovered previously written-off accounts.
Healthcare Finance Power BI Dashboard Template Components
A comprehensive healthcare finance Power BI dashboard typically comprises multiple specialized dashboards, each focused on a specific revenue cycle dimension. Together, these components provide 360-degree visibility into healthcare billing performance. Generally speaking, organizations building healthcare billing Power BI solutions should plan for multiple, interconnected dashboards.
Claims Dashboard
The claims dashboard displays claims volume submitted by period, claims status breakdown (submitted, accepted, denied, pending), clean claim rate percentage, and top denial codes with volume trends. Drill-down capability enables users to filter by department, provider, payor, or date range to isolate specific claim populations and understand performance drivers. Additionally, claims by status cards show pending claims requiring follow-up and identify potential aging issues.
Revenue Dashboard
This dashboard tracks revenue by payor, service line, and encounter type. Charts display gross charges, contractual adjustments, and net realized revenue to show true realization rates. Revenue trend lines by major payor help leaders spot shifts in revenue mix. Additionally, variance analysis comparing current period revenue to prior year helps identify unexpected changes requiring investigation.
Collections & Accounts Receivable Dashboard
Monitor DSO trend, accounts receivable aging buckets, patient responsibility versus insurance responsibility aging, and collection rate percentage. This dashboard enables rapid identification of collection deterioration and pinpoints which payor or department drives aging increases. Interactive filters allow drill-down to specific patient or payor populations for detailed analysis.
Denial Management Dashboard
Track denial rate percentage, top denial reason codes with volume and trend, denial turnaround time, and prevention metrics like clean claim rate and first-pass resolution rate. This dashboard surfaces which payors and departments generate highest denial rates, enabling targeted improvement initiatives. Additionally, denial reason trends reveal whether process changes or payor requirement updates are driving changes in denial patterns.
Executive KPI Scorecard
A high-level dashboard displays key metrics versus targets: DSO, denial rate, clean claim rate, collection rate, and revenue recognition trend. This scorecard provides leadership with instant visibility into revenue cycle health during executive meetings or board reviews. Moreover, color-coded indicators (green, yellow, red) flag metrics outside target ranges, prompting investigation and action.
Getting Started with a Healthcare Finance Power BI Dashboard
Building a healthcare finance Power BI dashboard requires a phased approach that prioritizes data quality and stakeholder alignment. Following these steps ensures your dashboard delivers value and maintains user adoption over time.
Step 1: Assess Your Data Architecture and Quality
Begin by auditing your source systems: EHR, practice management, billing, and accounting platforms. Identify which systems contain claims data, revenue data, payment data, and adjustments. Document data quality issues such as missing values, inconsistent date formats, or unmapped payor names. Additionally, confirm that your IT infrastructure supports real-time or near-real-time data extraction and that you have HIPAA-compliant data transfer protocols in place. This assessment informs whether you need a data warehouse or can connect Power BI directly to source systems.
Step 2: Define KPIs and Align Stakeholders
Partner with revenue cycle, billing, finance, and compliance teams to define your dashboard’s core KPIs and success metrics. Identify which metrics are most critical for leadership decision-making and which operational teams need daily visibility. Furthermore, establish target ranges for each KPI based on industry benchmarks or your organization’s historical performance. This alignment ensures your healthcare finance Power BI dashboard addresses actual business needs rather than building generic dashboards that nobody uses.
Step 3: Model Your Healthcare Billing Data
Work with your BI team to design a data model that correctly represents claims, revenue, payments, and adjustments. Establish relationships between claims and payments so you can track claim resolution. Additionally, create calculated columns for metrics such as days in accounts receivable (current date minus claim date) or denial rate percentage (denied claims divided by total submitted). A well-designed healthcare billing data model is the foundation for accurate, performant dashboards.
Step 4: Build and Iterate Dashboards
Start with high-impact dashboards such as claims and revenue, then add accounts receivable and denial management dashboards. Share early prototypes with end users and gather feedback on layout, drill-down capability, and metric definitions. Iterate based on feedback so your healthcare finance Power BI dashboard matches user needs and workflows. Additionally, test data refresh performance to confirm dashboards load quickly during peak usage times.
Step 5: Deploy, Govern, and Maintain
Set up automated data refresh schedules (hourly, daily, or weekly based on your workflow). Establish role-based access controls so billing staff see claims-level data, revenue cycle managers see department-level summaries, and finance leaders see executive scorecards. Additionally, document your dashboard definitions, data model relationships, and refresh procedures so your team can maintain and evolve the solution independently. Schedule quarterly reviews to assess dashboard usage and identify new KPIs or drill-down requirements.
Frequently Asked Questions
Can Power BI handle HIPAA-sensitive healthcare data?
Yes, Power BI supports HIPAA compliance when properly configured. The platform provides encryption in transit and at rest, role-based access controls to limit data visibility, and audit logging to track dashboard access. However, you must ensure your entire data architecture complies with HIPAA requirements: secure data extraction from source systems, encrypted transfer to Power BI, and restricted access to dashboards based on user role. Consult with your compliance and IT teams before deploying a healthcare finance Power BI dashboard to confirm your implementation meets HIPAA standards.
Which healthcare billing systems integrate with Power BI?
Power BI integrates with most major practice management, EHR, and billing platforms including Epic, Cerner, Medidata, Athena, NextGen Healthcare, and many others. Integration methods include direct database connections, API connectors, or data warehouse feeds. Your IT team can verify connector availability for your specific systems and determine the most secure integration approach. Additionally, Power BI supports importing data from Excel, CSV, and other file formats if direct system connectors aren’t available.
How often should healthcare billing dashboards refresh their data?
Refresh frequency depends on your workflow and reporting needs. Claims and revenue dashboards typically refresh hourly or daily to provide timely visibility into billing activity. Collections and accounts receivable dashboards can refresh daily or weekly since patient payment patterns change more slowly. Historical reporting and trend analysis dashboards may refresh nightly as batch jobs. Discuss your requirements with your BI team to determine the appropriate refresh schedule that balances data currency with system resource demands.
Do I need a data warehouse for healthcare finance dashboards?
Smaller medical practices may connect Power BI directly to their practice management or billing system if the system supports real-time queries and your data volume is modest. Larger healthcare organizations typically benefit from a dedicated data warehouse or data lake because it improves query performance, enables integration across multiple source systems, and provides a historical archive for trend analysis. A data warehouse also simplifies HIPAA compliance by centralizing data governance and access controls. Evaluate your organization’s data volume, system complexity, and analytical requirements to determine whether a data warehouse investment is justified.
How do I ensure my healthcare billing dashboard stays compliant?
Implement role-based access controls so each user sees only data relevant to their role: billing staff see claim-level detail, managers see departmental rollups, and executives see summary KPIs. Additionally, configure audit logging to track who accessed which dashboards and when. Document your data sources, transformation logic, and dashboard definitions in a central repository so your compliance team can validate the data pipeline. Furthermore, encrypt dashboards in transit and at rest, use strong authentication (multi-factor authentication) for dashboard access, and review your access policies quarterly with your privacy officer to ensure ongoing compliance.

Why Leading Healthcare Organizations Choose AscenWork for Healthcare Finance Power BI Dashboards
In our work with clients, we’ve seen that AscenWork brings hands-on experience implementing healthcare finance Power BI dashboards across hospital systems, billing service centers, and medical groups. Our team understands revenue cycle workflows, healthcare billing compliance requirements, and the nuances of integrating claims data across EHR, practice management, and accounting platforms. Furthermore, we build dashboards that solve real problems, not generic templates that require extensive customization.
| Factor | AscenWork | Generic BI Consultant |
|---|---|---|
| Healthcare Revenue Cycle Expertise | Specialized experience in healthcare billing workflows, KPIs, and compliance requirements | General BI knowledge; limited healthcare-specific context |
| Data Modeling Approach | Deep healthcare data model design addressing claims, revenue, AR, and compliance relationships | Standard data modeling that requires significant healthcare-specific customization |
| Template Availability | Ready-to-deploy healthcare finance templates accelerating time to value | Starting from scratch; higher implementation effort and cost |
| Ongoing Support | Ongoing maintenance, template updates, and healthcare KPI refinement based on industry changes | Hand-off after deployment; limited long-term partnership |
When you work with AscenWork on your healthcare finance Power BI dashboard, you gain a partner committed to understanding your revenue cycle challenges and building solutions that drive measurable improvements in claims processing efficiency, denial rates, and days sales outstanding.
Moreover, our approach emphasizes data quality and governance from day one. We audit your source systems, establish HIPAA-compliant data pipelines, and model your healthcare billing data correctly so your dashboards remain accurate and trustworthy. Additionally, we provide training to your team so you can maintain and evolve your healthcare billing Power BI dashboards independently as business needs change.
Industry Applications of Healthcare Finance Power BI Dashboards
Healthcare finance Power BI dashboards apply across diverse healthcare settings. Each vertical brings unique reporting and compliance requirements that shape dashboard design and KPI selection.
Hospital Systems and Health Networks
Multi-hospital health systems require consolidated visibility into claims, revenue, and collections across dozens of facilities and departments. A healthcare finance Power BI dashboard enables centralized finance leadership to monitor DSO by hospital, denial rates by department, and revenue recognition by service line. Additionally, local billing teams gain department-level detail to drive local process improvements while corporate finance tracks system-wide performance against budget.
Medical Billing Service Centers
Revenue cycle outsourcers process millions of claims annually for hundreds of client practices. A healthcare billing Power BI dashboard tracks claims intake, submission volume, turnaround time, and performance metrics by client account. This visibility enables proactive client communication, rapid identification of performance issues, and data-driven resource planning. Furthermore, dashboards demonstrate service quality to clients and support contract renewal discussions.
Independent Medical Practices and Group Practices
Smaller organizations often lack the resources to build complex reporting infrastructure. A lightweight healthcare finance Power BI dashboard connects directly to practice management systems and provides day-to-day visibility into claims, collections, and revenue without heavy IT overhead. Practices see return on investment quickly as billing teams spend less time on manual reporting and more time on revenue cycle optimization.
Accountable Care Organizations (ACOs) and Value-Based Care Networks
Organizations operating under risk-based contracts require real-time visibility into revenue, utilization, and quality metrics. A healthcare finance Power BI dashboard integrates claims, payment, and quality data to support performance monitoring and risk management. Additionally, dashboards enable rapid response to contract performance deviations and support financial forecasting under value-based payment models.
Transform Your Healthcare Revenue Cycle Today
Healthcare finance Power BI dashboards eliminate manual reporting, reveal optimization opportunities, and give your team the visibility they need to drive revenue cycle performance. Let AscenWork help you build a dashboard that consolidates claims, revenue, and collections data into actionable intelligence for your entire organization. Connect with our healthcare BI specialists to discuss your dashboard requirements and explore how real-time visibility can improve your revenue cycle efficiency.