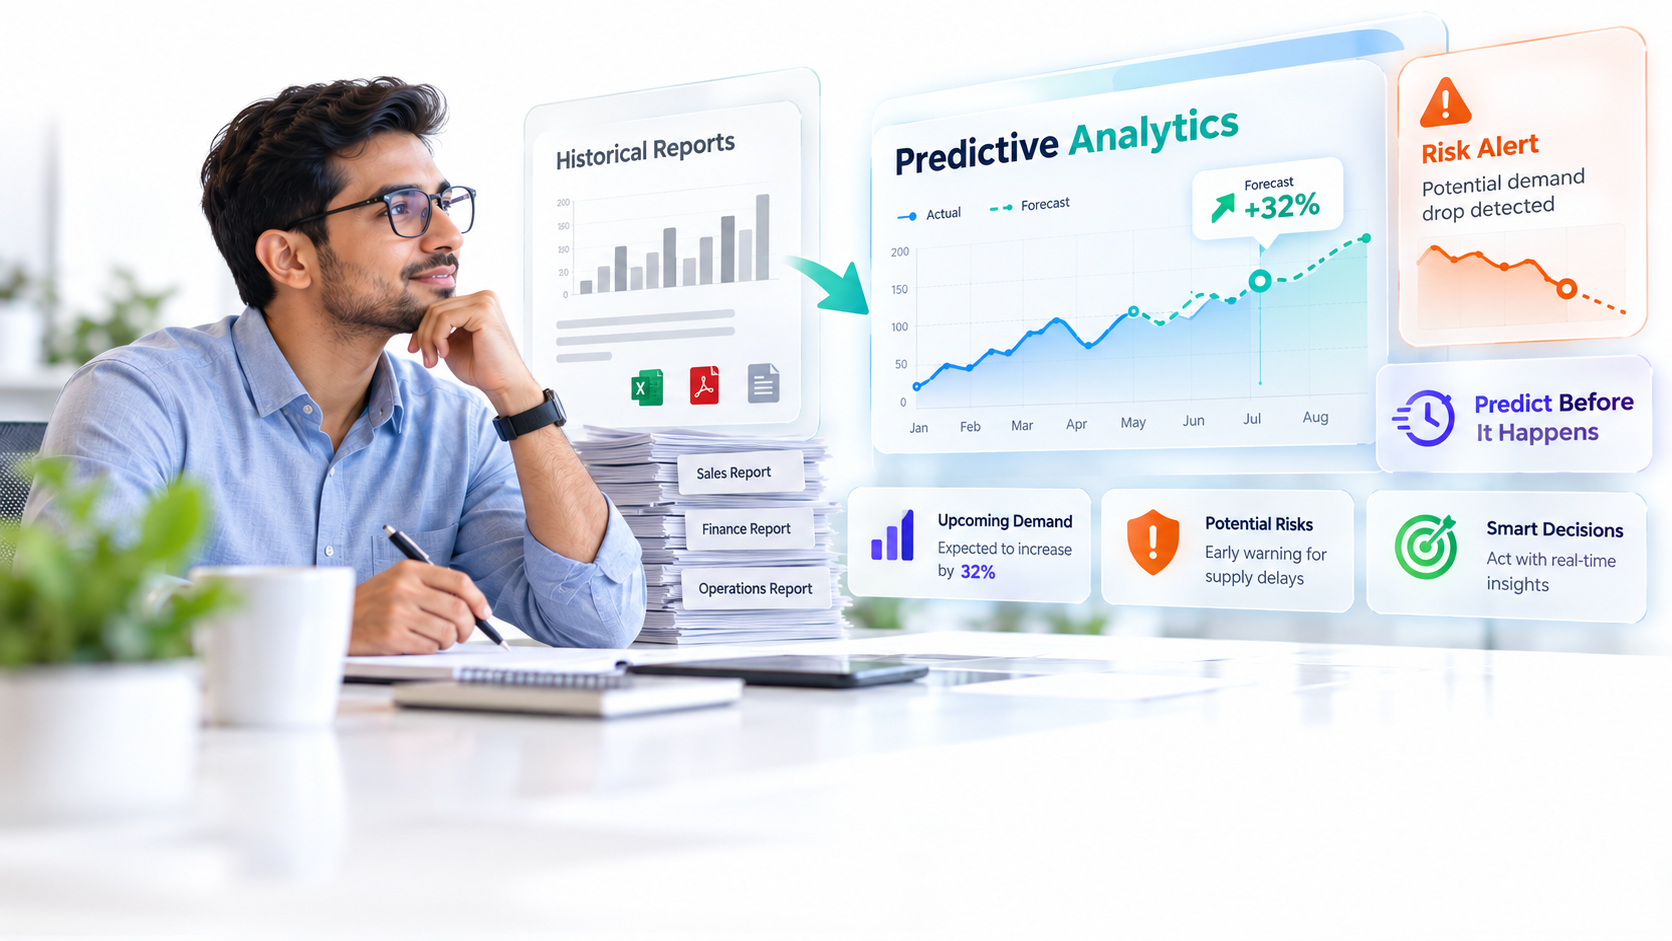
From Reporting to Predicting: How AI-Powered Dashboards Flag Problems Before They Happen
Predictive analytics dashboards transform the way leaders see their business. Here’s the reality: most executives wake up to reports full of yesterday’s numbers. By the time a problem shows up in traditional reporting, you’ve already lost time and momentum. Modern AI-powered dashboards work differently. They scan patterns in real-time data and alert you to risks weeks before they materialize. The result: faster decisions, prevented crises, and competitive advantage.
Key Takeaway
The difference between a traditional dashboard and a predictive analytics dashboard isn’t just more data. It’s the ability to see around corners and act before problems spiral out of control.
In This Article
- Why Traditional Dashboards Leave Leaders Behind
- The Core Challenge: Moving Beyond “What Happened” to “What’s Next”
- The Solution: AI-Powered Predictive Analytics Dashboards
- Why Leading Businesses Choose Predictive Analytics Dashboards
- Industry Applications
- How to Get Started
- Frequently Asked Questions
Why Traditional Dashboards Leave Leaders Behind
Traditional business intelligence dashboards serve a purpose. They aggregate historical data, visualize trends, and give you visibility into what already happened. But there’s a catch. Data must be collected, validated, aggregated, and pushed to the dashboard before you see it. That process takes hours or days. By the time a concerning pattern appears on screen, the underlying problem has often compounded.
Consider a supply chain example. A traditional dashboard might flag that inventory levels dropped 15% last week. But by last week, your supplier was already facing production delays. A predictive analytics dashboard, by contrast, would’ve identified the supplier’s performance trend and flagged risk three weeks earlier. You’d have had time to adjust orders, find alternatives, or communicate with customers proactively.
The cost of reactive management adds up fast. Operations teams spend energy responding to crises instead of preventing them. Leadership makes decisions based on incomplete information. Forecasts miss targets because they’re built on historical patterns that don’t capture emerging anomalies. Resources get allocated to firefighting instead of growth.
Organizations that rely on reactive reporting spend 40% more time on incident response and remediation than those using predictive monitoring systems.
Gartner, 2024 BI and Analytics Trends Report
This is where predictive analytics dashboards change everything. Instead of waiting for a problem to surface, these systems anticipate it.
The Core Challenge: Moving Beyond “What Happened” to “What’s Next”
Business leaders face a consistent tension. Dashboards report what happened. Leaders need to know what’s coming. This gap creates blind spots that cost time, money, and competitive advantage.
Here are the core pain points traditional dashboards simply can’t address:
- Alert lag: Issues surface only after they’ve already begun affecting operations. By then, your options are limited and remediation is expensive.
- Linear thinking: Historical dashboards assume past trends continue. They miss non-linear changes, anomalies, and inflection points where business dynamics suddenly shift.
- Siloed insights: Data lives in separate systems. A pattern that’s obvious across multiple datasets remains invisible when each one is monitored in isolation.
- Manual forecasting: Leadership relies on spreadsheet models and intuition to project KPIs. These approaches are time-consuming, prone to bias, and often inaccurate.
- Low confidence: Without explainability, leaders don’t trust algorithmic predictions. They question the methodology, doubt the output, and revert to gut feel.
- Static thresholds: Traditional alerts trigger when a metric crosses a fixed number. They can’t distinguish between seasonal variation and genuine risk.
The consequence is clear. Teams that can’t anticipate risks lose competitive advantage. They face higher operational costs due to reactive fixes. They struggle to justify BI investments when dashboards only show “what happened” instead of pointing toward the future.
The Solution: AI-Powered Predictive Analytics Dashboards
Predictive analytics dashboards represent a fundamental shift in how organizations use data. Rather than passively observing historical trends, these systems actively learn from patterns and forecast what comes next.
Here’s what happens. Machine learning models train on years of historical business data. The models identify patterns that correlate with outcomes you care about: churn, demand spikes, quality issues, cash flow constraints, equipment failure, and so on. Once trained and validated, these models run continuously against incoming data. When the system detects patterns that historically preceded a problem, it flags them immediately. Leadership sees a forward-looking alert, not a historical report.
A predictive analytics dashboard addresses each pain point head-on:
- Early warning: Anomalies and predictive signals surface weeks before traditional methods would catch them, giving teams time to act.
- Non-linear pattern detection: AI models capture complex relationships that linear extrapolation misses. They recognize when things are about to change.
- Holistic insight: Predictive systems ingest data from multiple sources and identify hidden correlations across the organization.
- Automated forecasting: Models eliminate manual spreadsheet work and bias, running continuously and improving as they learn from outcomes.
- Explainability: Modern platforms show leaders why a prediction was made. Which factors triggered the alert? What confidence level should they assign?
- Adaptive thresholds: The system learns what “normal” looks like in context. It distinguishes seasonal patterns from genuine anomalies.
Expert Perspective
In our work with clients, we’ve learned that predictive models work best when combined with domain expertise. The dashboard surfaces patterns and forecasts. Your team, the people who actually understand the business context, validates those predictions, contextualizes them, and decides how to act. The goal is augmentation, not replacement. AI surfaces the signals; humans make the decisions.
When evaluating a predictive analytics dashboard, look for these capabilities:
- Interpretability: Can the system explain why it made a prediction? Poor explainability erodes trust.
- Scalability: Does it handle complex datasets across your entire organization, not just one department?
- Integration: Can it pull data from your existing systems, data warehouses, ERPs, CRMs, APIs without months of custom coding?
- Continuous learning: Does the model improve over time as it sees real-world outcomes and learns from prediction accuracy?
- Governance: Can you audit how models were trained, what data they use, and detect bias or drift?
Why Leading Businesses Choose Predictive Analytics Dashboards
The shift from reactive to predictive is accelerating across industries. Leaders aren’t settling for dashboards that show what happened. They’re investing in systems that show what’s coming next.
| Factor | Predictive Analytics Dashboard | Traditional BI Dashboard |
|---|---|---|
| Data Timeliness | Real-time plus forward-looking forecasts | Historical with inherent lag |
| Alert Mechanism | Anomaly detection plus predictive triggers | Fixed thresholds only |
| Actionability | Proactive recommendations with time to act | Reactive insights after problems surface |
| Model Complexity | Machine learning with pattern recognition | Rule-based static logic |
| Confidence Level | Explainable with accuracy scores | Simple percentage or yes/no |
Three factors distinguish predictive dashboards. First, speed to insight matters. A predictive system flags emerging risks in minutes. Traditional reporting takes hours. Second, accuracy improves over time. Machine learning models outperform linear extrapolation because they capture non-linear relationships. Third, scalability determines impact. A predictive system that works across multiple data sources and business units drives organization-wide benefit. A single-purpose forecasting model helps one team.
Organizations adopting predictive analytics dashboards report faster decision cycles, fewer operational surprises, and better resource allocation. The competitive advantage compounds because the organization learns faster, acts sooner, and adapts ahead of market shifts.
Industry Applications
Financial Services
Banks and fintech companies use predictive analytics dashboards to anticipate credit risk before loan defaults occur. Fraud detection models identify suspicious transaction patterns in real-time. Cash flow forecasting prevents liquidity crunches by predicting funding needs weeks in advance. Portfolio managers use predictive signals to adjust holdings before market movements fully materialize.
Healthcare
Hospitals deploy predictive dashboards to identify patients at high risk of readmission. Models flag which equipment is degrading and likely to fail, triggering maintenance before downtime occurs. Bed occupancy forecasting optimizes staffing and resource allocation. Patient flow predictions help emergency departments prepare for surges.
Retail and E-Commerce
Retailers use demand forecasting to optimize inventory before peak seasons. Supply chain dashboards predict bottlenecks in logistics networks. Churn models identify customers at risk of leaving, enabling retention outreach before defection happens. Dynamic pricing systems adjust based on predicted demand elasticity.
Manufacturing
Manufacturers deploy predictive maintenance systems that monitor equipment health and alert teams to degradation before breakdown. Production planning becomes more accurate because demand forecasts factor in predictive signals. Quality predictions catch potential defects before products reach customers.
How to Get Started
Implementing a predictive analytics dashboard doesn’t require waiting years or hiring an entire data science team. That said, it does require deliberate steps and realistic expectations.
- Assess readiness. Audit your data quality, identify which business outcomes matter most to predict, and ensure stakeholder alignment on what success looks like. Outcome: clear mandate and baseline understanding of your data landscape.
- Define use cases. Prioritize two to three high-impact prediction scenarios. Focus on problems where early warning creates real business value. Outcome: focused scope and measurable success criteria.
- Integrate data sources. Connect relevant systems, data warehouses, ERPs, CRMs, operational databases, and validate data pipeline integrity. Outcome: clean, reliable dataset ready for model development.
- Build and validate models. Develop initial predictive models, test accuracy on historical data, and establish confidence thresholds for alerts. Document assumptions and limitations. Outcome: trained models with documented assumptions that perform well in testing.
- Deploy and monitor. Launch the dashboard in your organization, gather feedback from users, and continuously refine models based on real-world prediction accuracy. Outcome: live predictive system feeding into decision-making workflows.
Here’s the thing: start small and build momentum. Pick one high-impact use case, validate that the approach works, then expand to other areas of the organization.
Frequently Asked Questions
Can AI-powered dashboards predict everything?
No. Predictive models are most accurate when trained on stable historical patterns. They excel at forecasting business metrics like demand, churn, and cash flow. They’re less reliable for unprecedented events or black swan scenarios. That’s why human judgment remains essential. Use the dashboard to amplify your team’s decision-making, not replace it.
How long does it take to see results from a predictive analytics dashboard?
Early patterns and alerts can surface within weeks of deployment. Model accuracy improves over months as the system learns from real-world outcomes and you refine the underlying assumptions. Continuous monitoring and refinement are essential. Expect iteration, not instant perfection.
Do we need a dedicated data science team to use a predictive dashboard?
Not necessarily. Modern platforms are designed for business users with BI experience. That said, you do need domain expertise. Someone on your team must understand the business context, validate predictions, and spot when the model needs retraining. That could be a BI analyst, subject-matter expert, or analytics manager.
How does a predictive dashboard handle bias in historical data?
Bias awareness is part of responsible AI. Audit your training data for historical imbalances. Set up guardrails to prevent bias amplification. Combine algorithmic output with human judgment before making high-stakes decisions. No predictive model is bias-free. The goal is transparency and active mitigation.
What’s the difference between a predictive dashboard and a forecasting model?
A forecasting model predicts a single metric, like revenue next quarter. A predictive analytics dashboard integrates multiple models, alerts, and contextual data into a single interface. The dashboard helps leaders see patterns across the organization and act on them faster.
Ready to See Problems Before They Happen
Predictive analytics dashboards give leadership the foresight to act proactively instead of reacting to crises. Your team deserves tools that show what’s coming next, not just what already happened. Let’s explore how a predictive dashboard could transform your decision-making.