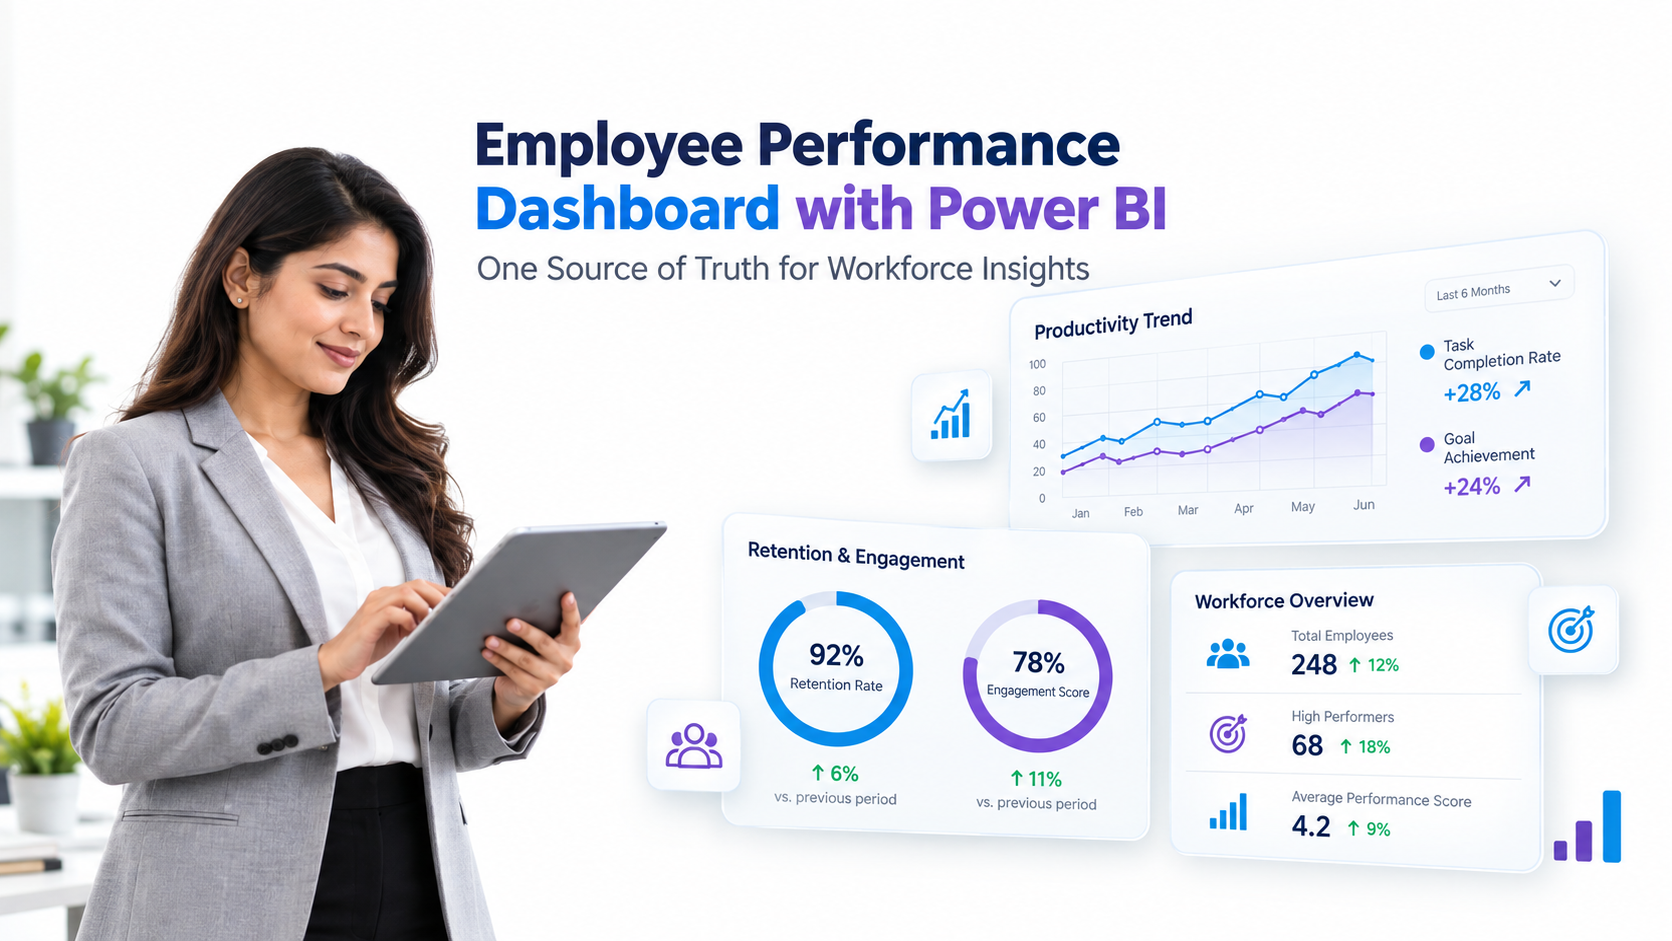
Build a Powerful Employee Performance Dashboard with Power BI
Employee performance dashboards transform how HR teams track workforce metrics and make data-driven decisions. We’ve worked with dozens of organizations still relying on fragmented spreadsheets scattered across multiple systems, creating visibility gaps that waste time and delay critical insights. A centralized HR KPI dashboard powered by real-time data changes everything. It enables leaders to monitor productivity, retention, engagement, and business impact from a single source of truth.
Key Takeaway
An employee performance dashboard gives HR leaders real-time visibility into workforce KPIs, reducing manual reporting by up to 80% and enabling faster, data-driven people decisions that directly impact retention and productivity.
In This Article
- Why Employee Performance Dashboards Matter Now
- The Core HR Challenge: Fragmented Performance Data
- The Solution: HR KPI Dashboards Powered by Real-Time Data
- Why Leading Organizations Choose Power BI for HR Analytics
- Industry Applications: Employee Performance Dashboards Across Sectors
- How to Build Your Employee Performance Dashboard
- Frequently Asked Questions
Why Employee Performance Dashboards Matter Now
The shift toward hybrid and remote work has fundamentally changed how organizations measure employee performance. In-person observation no longer provides reliable visibility into productivity and engagement. According to the Society for Human Resource Management (SHRM), 73% of organizations now prioritize data-driven HR decision-making over intuition-based assessments.
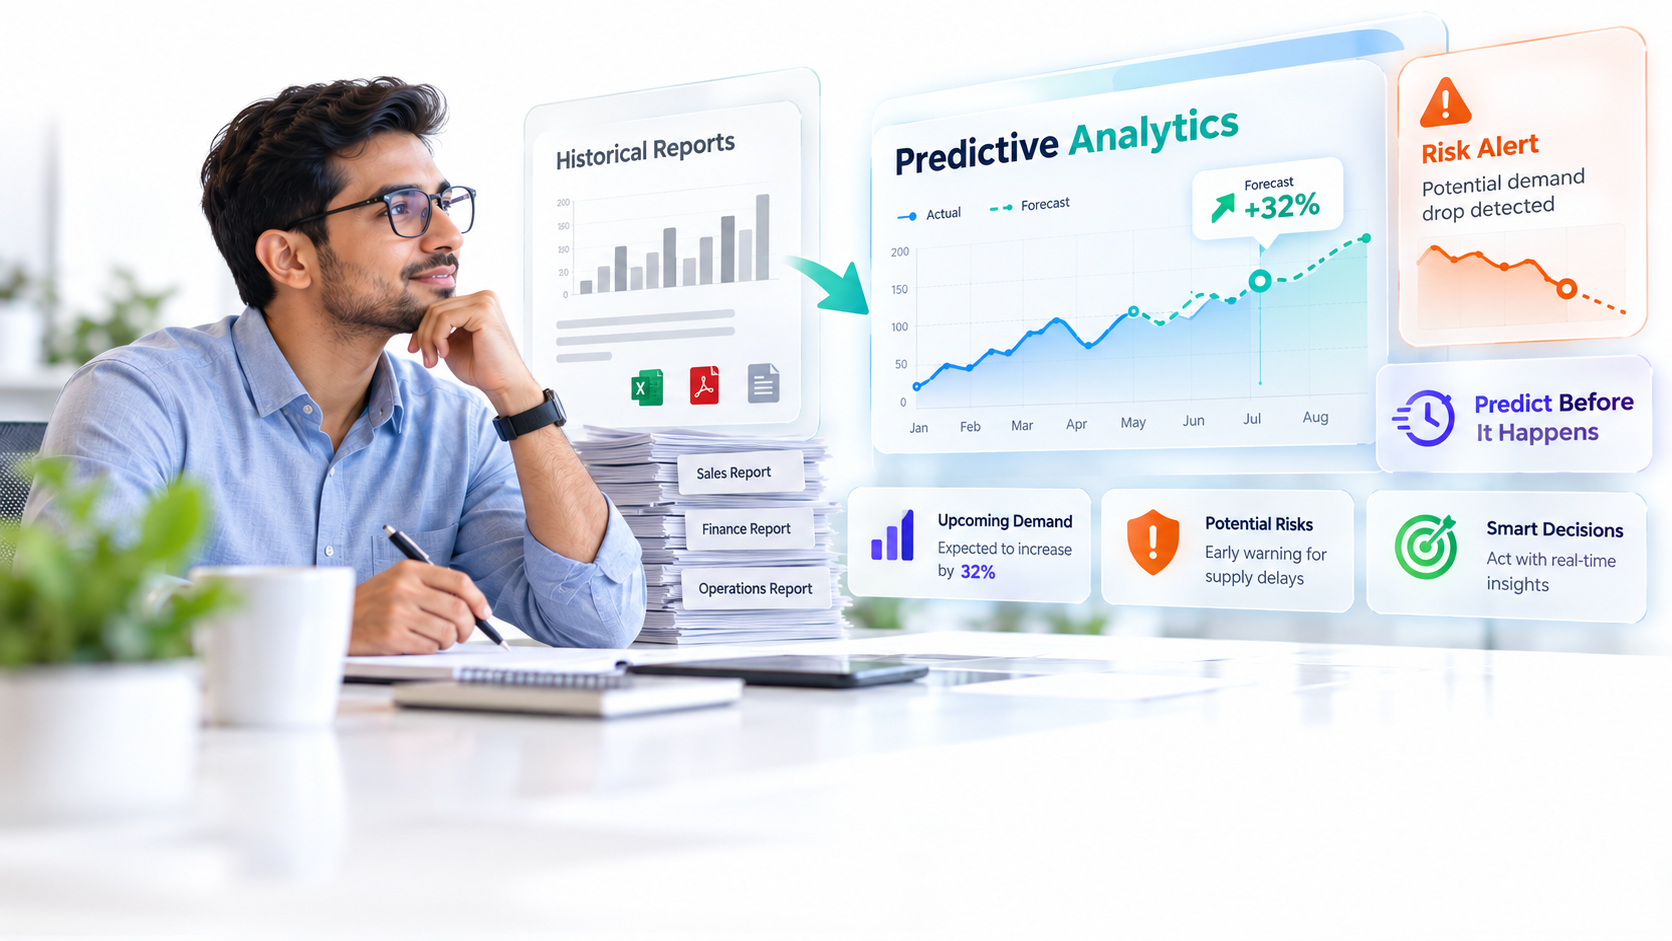
Real-time performance visibility isn’t a competitive advantage anymore, it’s a business necessity. Organizations using HR analytics platforms report measurably better outcomes across retention, productivity, and strategic alignment. Yet most HR teams still compile monthly or quarterly reports manually, missing early warning signs of attrition, disengagement, or skill gaps. Sound familiar?
Organizations using HR analytics platforms report 23% higher profitability. Only 25% of enterprises currently have mature HR analytics capabilities.
Gartner Magic Quadrant for Business Intelligence Platforms, 2024
An employee performance dashboard eliminates this lag. By connecting your HRIS, payroll, ATS, and business systems in real-time, you transform HR from a reactive function into a strategic partner capable of predicting and preventing problems before they escalate.

The Core HR Challenge: Fragmented Performance Data
Most HR teams juggle performance data across a disconnected ecosystem of systems. Your HRIS holds employee records and compensation data. Your ATS contains recruitment and time-to-hire metrics. Payroll systems track attendance and overtime. Engagement surveys live in a separate platform. Learning management systems log training completion. And department leaders keep their own performance ratings in spreadsheets or email. It’s a mess.
This fragmentation creates predictable problems:
- Performance data scattered across multiple systems with no single source of truth, making it impossible to correlate metrics or identify trends quickly
- Manual report compilation consuming 10+ hours per week, delaying decision-making and preventing proactive interventions
- Inconsistent KPI definitions across departments, so “productivity” means different things in sales versus customer success
- No drill-down capability, making it difficult to identify which specific teams or individuals are underperforming until issues become critical
- Incomplete audit trails and compliance documentation, creating governance and audit risk
- Inability to correlate performance data with business outcomes, making it nearly impossible to demonstrate HR’s strategic value to the C-suite
The consequence is clear: without unified performance visibility, HR teams operate reactively instead of strategically. They discover retention problems too late to intervene. They can’t predict which high performers are flight risks. They struggle to justify HR budget increases because they can’t quantify their impact on business results.
The Solution: HR KPI Dashboards Powered by Real-Time Data
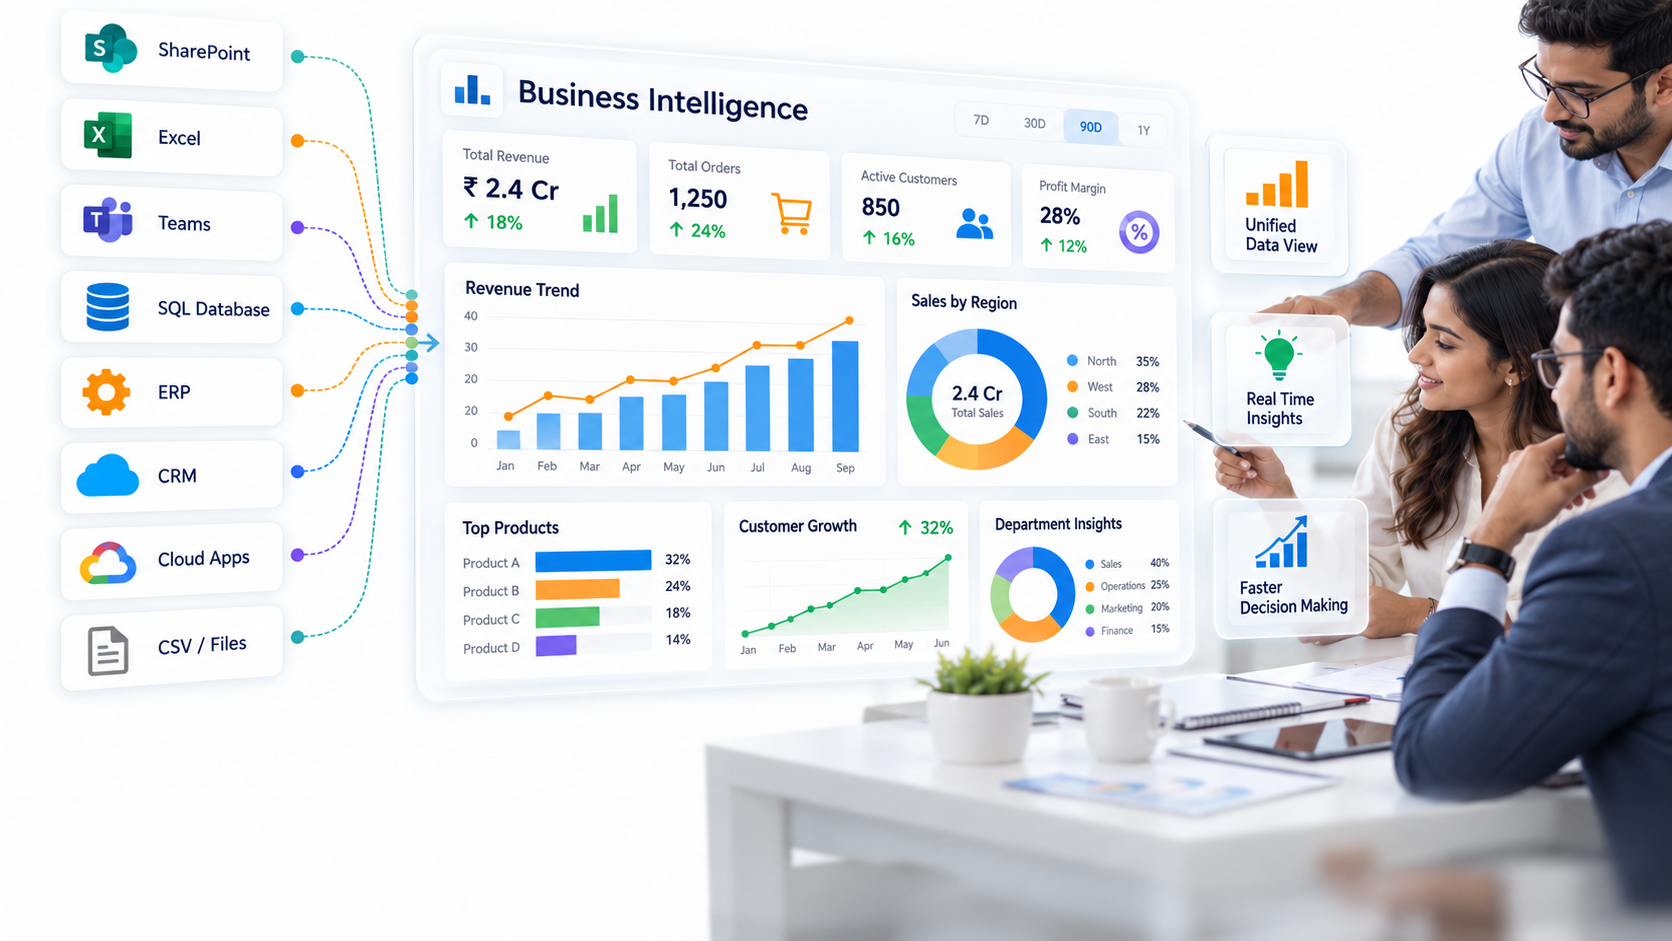
An employee performance dashboard centralizes performance data from every HR system into one unified, always-current source of truth. Real-time synchronization means managers and HR leaders see the same metrics, eliminating confusion and enabling faster, more confident decisions.
Here’s how the right dashboard architecture solves each pain point:
- Centralization: Connect data from HRIS, ATS, payroll, learning systems, and business platforms, revenue, customer satisfaction, project data, into a single cloud-based repository
- Speed: Automated data pipelines replace manual spreadsheet compilation, dashboards update daily or in real-time without manual effort
- Consistency: Define KPIs once at the organizational level, apply them universally across all departments with consistent methodology
- Visibility: Drill down from organization to department to team to individual performance with visual indicators that highlight trends and anomalies
- Compliance: Audit trails and version history built into the platform ensure all performance decisions are documented and traceable for compliance reviews
- Strategic Context: Layer employee performance data against business metrics to show clear correlation between workforce quality and organizational outcomes
Expert Perspective
Power BI’s true strength is flexibility. You can build an employee performance dashboard tailored to your specific HR challenges, whether that’s reducing time-to-hire, improving retention rates, tracking DEI metrics, or monitoring training completion. Here’s the thing most guides won’t tell you: success depends entirely on data quality and a clear KPI strategy. Without both, even the most sophisticated dashboard becomes noise rather than insight.
When evaluating any employee performance dashboard platform, prioritize these capabilities:
- Wide integration scope: connects seamlessly to your existing HRIS, payroll, ATS, and business systems without manual data exports
- Drill-down and filtering: slice data by department, role, location, tenure, performance level, and custom dimensions to pinpoint issues
- Mobile-friendly interface: enables managers to check KPIs and respond to issues on the go, not just at a desk
- Role-based security: ensures employees only see data relevant to their role and responsibility, protecting privacy and maintaining hierarchy
- Customizable templates: provide a fast starting point without forcing your HR strategy to fit a pre-built template
- Performance and scalability: can handle millions of rows of historical data without performance degradation as your organization grows
Why Leading Organizations Choose Power BI for HR Analytics
Power BI has emerged as the platform of choice for enterprise-scale HR analytics, particularly in organizations already invested in the Microsoft ecosystem. Its combination of depth, flexibility, and integration breadth makes it ideal for building sophisticated employee performance dashboards that scale with your organization.
| Factor | Power BI + HR Strategy | Spreadsheet-Based | Generic HR Dashboard |
|---|---|---|---|
| Real-time data refresh | Real-time or hourly updates | Manual only | Limited, daily or weekly |
| Integration scope | 50+ HR and business systems | Copy-paste manual imports | HRIS-focused only |
| Customization depth | Fully customizable to your KPIs | Very limited by column count | Pre-built templates only |
| Scalability limit | Enterprise-ready, millions of rows | Breaks down at 100K+ rows | Limited to small or mid-size orgs |
| Total cost of ownership | Moderate licensing plus lower labor | Low upfront, high labor hours | High licensing plus setup fees |
| Audit trail & compliance | Comprehensive logging built-in | Poor, no audit trail | Basic features only |
Three key advantages distinguish Power BI for HR analytics. First: flexibility. You build dashboards that match your specific HR strategy and KPI framework, not force your strategy into someone else’s template. Second: scalability. Start with a single department, expand to enterprise-wide performance tracking across thousands of employees without platform limitations. Third: integration. Power BI connects to virtually every major HRIS, payroll, and business system via direct connectors or APIs, creating a truly unified view of workforce performance and business impact.
Power BI’s foundation in Microsoft’s cloud infrastructure (Azure) also means seamless integration with Azure Active Directory for role-based access control, Microsoft Teams for collaboration, and the entire Microsoft 365 ecosystem. For organizations already using Dynamics 365, Excel, or Office 365, Power BI becomes a natural extension of your existing tech stack. And here’s the thing: it also connects to Salesforce, SAP, Google Analytics, Workday, SuccessFactors, BambooHR, and hundreds of other platforms, avoiding vendor lock-in.

Industry Applications: Employee Performance Dashboards Across Sectors
Finance & Banking
Financial services organizations face intense regulatory pressure and high-stakes hiring costs. We’ve seen employee performance dashboards track compliance training completion rates, time-to-productivity for new hires, and team-level sales pipeline influence. Key metrics include turnover cost per department, regulatory certification renewal status, and training hours per employee. This enables banks to identify skill gaps early, prevent compliance violations, and reduce costly turnover in critical roles.
Healthcare & Life Sciences
Healthcare providers struggle with staffing complexity and patient safety accountability. Employee performance dashboards monitor shift staffing ratios, clinical certification status, training hours, and patient satisfaction correlation with specific care teams. Critical KPIs include staff-to-patient ratio by unit, certification renewal status by department, and retention rates by role. This visibility enables proactive staffing adjustments, prevents compliance lapses, and improves care quality through data-driven team management.
Retail & E-Commerce
Retail organizations require real-time visibility into sales productivity and customer impact. Employee performance dashboards track sales per employee by location, customer satisfaction scores by store, training completion rates, and shrinkage metrics linked to loss prevention. Key metrics include conversion rate by sales associate, customer NPS by location, training program effectiveness, and absenteeism trends. This enables rapid performance interventions, better scheduling, and faster identification of top talent for promotion.
Technology & Professional Services
Tech and consulting firms live or die by resource utilization and project profitability. Employee performance dashboards monitor billable hours, project utilization rates, client satisfaction scores, and skill certification levels. Core KPIs include resource utilization rate, project profitability by team member, client NPS by engagement, and identified skill gaps. This transparency enables better resource allocation, faster project staffing decisions, and clear identification of professional development needs.
How to Build Your Employee Performance Dashboard
Building an effective employee performance dashboard follows a logical five-step progression. Each step builds on the previous one, ensuring your final dashboard aligns with business strategy and uses clean, trustworthy data.
- Define Your HR Strategy & Core KPIs: Meet with your HR leadership team, department heads, and executive sponsors to identify 5 to 10 core performance metrics aligned to business outcomes. Action: Document KPI definitions, ownership, and calculation methodology. Outcome: Shared understanding across the organization of what success looks like and how you’ll measure it.
- Audit Your Data Sources & Quality: Map where each KPI lives within your current systems, HRIS, ATS, payroll, surveys, project management platforms. Assess data quality, consistency, and completeness. Action: Create a data source inventory, identify gaps, inconsistencies, or missing elements. Outcome: Clear picture of data readiness and any data cleanup required before dashboard launch.
- Set Up Power BI Connections & Data Model: Connect Power BI to your HR systems using built-in connectors, APIs, or data gateways. Create a unified data model that links employee records, performance data, and business outcomes. Action: Test data refresh cycles and validate calculations against source systems. Outcome: Clean, unified dataset ready for visualization, with documented data lineage and quality checks.
- Design Dashboard Pages for Different Audiences: Build role-based dashboard views tailored to each user’s needs. Executive dashboards show high-level trends and strategic metrics. Department manager dashboards enable drill-down into team performance. HR ops dashboards provide detailed reporting for compliance and process improvement. Action: Create mockups, gather feedback from stakeholders. Outcome: Dashboards that provide actionable insights to each role without overwhelming them with irrelevant data.
- Launch, Train, and Iterate Continuously: Roll out dashboards in phases, provide hands-on training to each user group, collect feedback and refine visualizations and KPIs quarterly. Action: Monitor adoption rates and address barriers quickly. Outcome: Organization-wide adoption and continuous improvement based on real user feedback and evolving business needs.
This structured approach prevents common dashboard failures like poor user adoption, dashboards nobody uses, misaligned metrics, dashboards that don’t answer business questions, or data quality issues, dashboards that show unreliable numbers. By investing time upfront in strategy and data quality, you build a dashboard that actually gets used and drives decisions.
Frequently Asked Questions
What HR systems does Power BI integrate with?
Power BI connects to virtually all major HRIS platforms including Workday, SuccessFactors, ADP, BambooHR, Paychex, and Guidepoint via direct connectors or APIs. It also integrates seamlessly with Azure Active Directory, Outlook, Teams, Excel, Salesforce, SAP, Google Analytics, and hundreds of other business applications. This breadth means you’re not locked into a single vendor ecosystem. You can pull data from wherever it lives in your organization.
Do I need a data analyst to build an HR employee performance dashboard?
No, but it helps. Power BI offers drag-and-drop visualization tools accessible to business users without coding experience. However, for complex data modeling, connecting multiple HR systems, creating advanced calculated fields, or building data quality validations, a data analyst or Power BI developer accelerates implementation and ensures adherence to best practices. Many organizations start with a technical partner for setup, then transition maintenance to internal HR or IT teams.
Can I use an employee performance dashboard template to launch faster?
Yes. Microsoft and third-party vendors offer pre-built HR dashboard templates as a starting point. Templates accelerate launch by providing proven layouts and calculations. That said, templates typically require customization to align with your specific KPIs, data sources, business terminology, and HR processes. Treat templates as a foundation, not a finished product. Plan time for modifications that make the dashboard relevant to your organization.
How often should my employee performance dashboard refresh, and does real-time data actually matter?
Refresh frequency depends on your use case. For executive reviews and strategic planning, daily refresh is typically sufficient. For real-time operational decisions, like staffing adjustments, incident response, or sales performance management, hourly or live streaming updates provide greater value. Power BI supports both scheduled refreshes, cost-efficient for historical data, and real-time streaming, useful for high-velocity operational metrics. Match your refresh frequency to the decision velocity required by each dashboard user.
What’s the biggest challenge in implementing an HR employee performance dashboard?
Data quality and organizational alignment are the real obstacles, not the technology itself. If your underlying HRIS data contains inconsistencies, missing fields, or duplicate records, no dashboard will fix that problem. Additionally, if your organization hasn’t aligned on KPI definitions or how to measure success, the dashboard becomes a source of confusion rather than clarity. Success requires investment in data governance and stakeholder alignment before you ever open Power BI. Also read our related article on HR analytics templates for workforce reporting and decision-making to understand how systematic KPI frameworks prevent these issues.
Ready to Transform Your HR Performance Reporting
A centralized employee performance dashboard replaces spreadsheet chaos with real-time, actionable insights your entire team can trust. Let’s discuss your specific HR challenges and build a dashboard strategy aligned to your business goals.