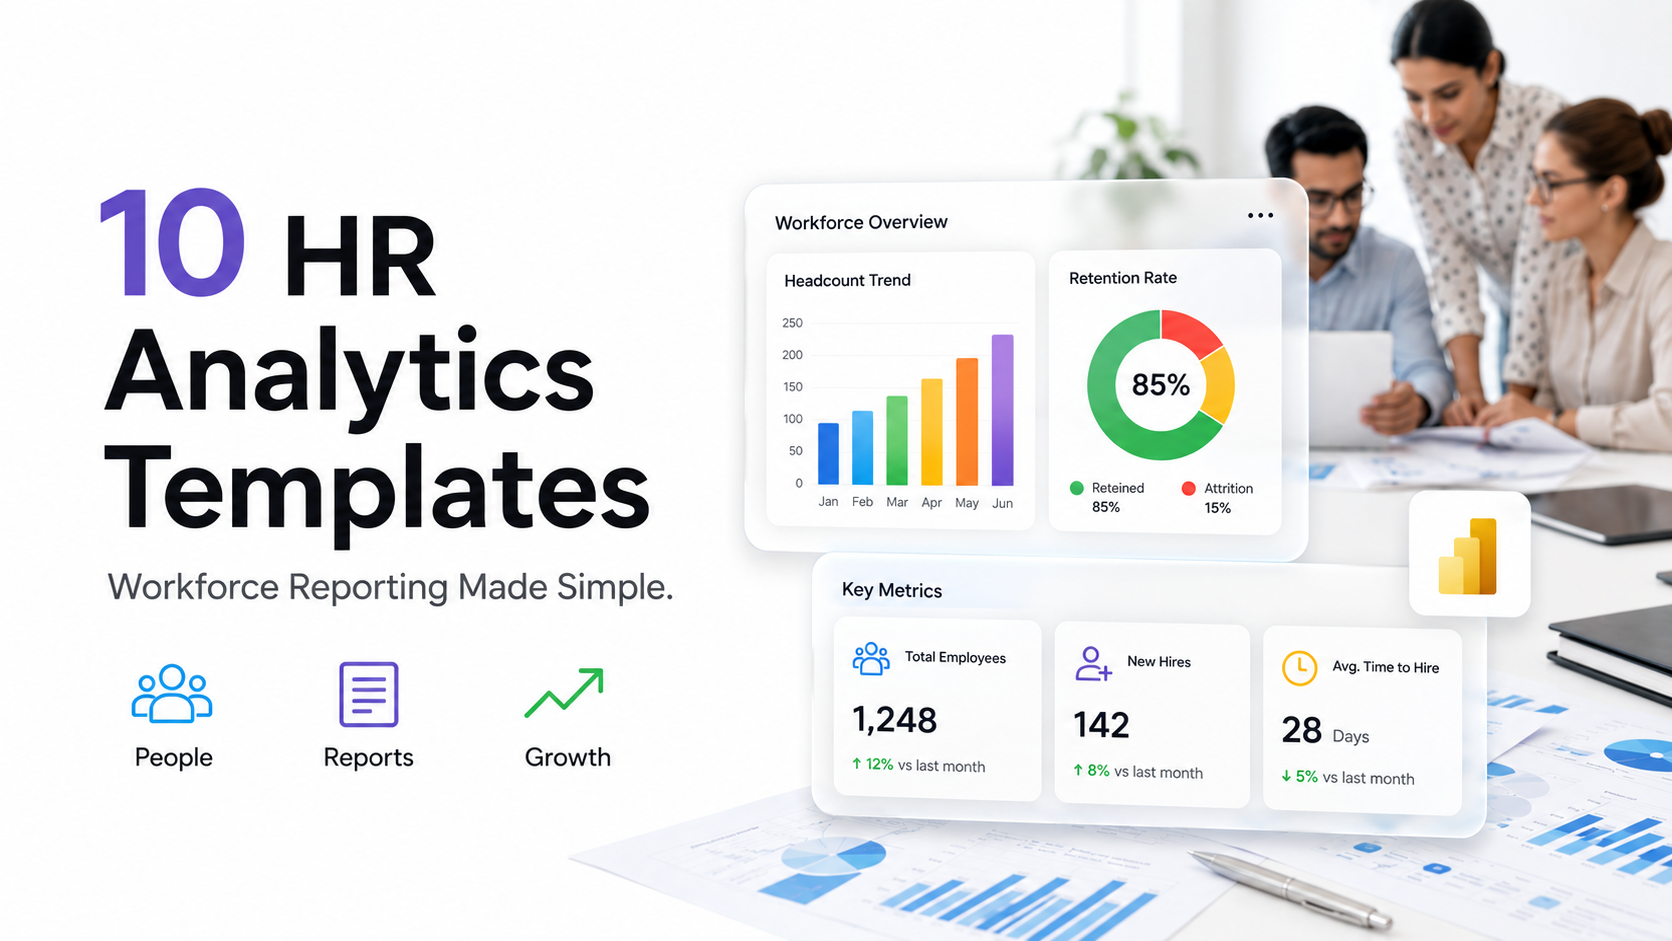
HR Analytics Templates: Workforce Reporting Made Simple
HR analytics templates transform how organizations track, measure, and optimize workforce performance. Most HR departments spend 20+ hours per month manually compiling data from scattered spreadsheets, ATS systems, and HRIS platforms. A well-designed HR analytics template eliminates this friction by creating a single source of truth for recruitment, retention, compensation, and engagement metrics. This guide walks you through ten essential HR analytics templates that accelerate reporting while enabling data-driven talent decisions.
Key Takeaway
HR analytics templates reduce reporting time by 50 to 70% and create consistent, real-time visibility into workforce trends across recruitment, retention, compensation, and engagement.
In This Article
- Why Workforce Analytics Matters Now
- The Core Challenge: Fragmented Workforce Data
- The Solution: HR Analytics Templates and Dashboards
- Core HR Metrics Every Workforce Dashboard Should Track
- Industry Applications: Real-World Use Cases
- How to Get Started with HR Analytics Templates
- Frequently Asked Questions
- Ready to Simplify Your Workforce Reporting?
Why Workforce Analytics Matters Now
The business landscape demands real-time visibility into workforce dynamics. Remote and hybrid work models have fragmented talent across geographies and time zones, making centralized tracking essential. Senior leadership now expects HR to quantify impact, prove ROI, and align hiring strategy to revenue growth. Without structured workforce analytics templates, HR teams operate reactively, responding to crises instead of anticipating talent gaps.
“79% of HR leaders report that access to timely, accurate workforce data significantly influences strategic hiring and retention decisions.”
SHRM Workplace Forecast Study, 2023
Organizations using structured HR analytics templates report faster hiring cycles, lower attrition in critical roles, and clearer pay equity visibility. On top of that, templated reporting frameworks create institutional memory and consistency, ensuring that KPI definitions remain uniform across teams and time periods.
Here’s the thing most guides won’t tell you: modern HR analytics templates integrate seamlessly with systems like Workday, BambooHR, and LinkedIn Recruiter, automating the manual data pulls that consume HR budgets. This automation frees HR professionals to focus on strategy, culture, and talent development rather than spreadsheet management.

The Core Challenge: Fragmented Workforce Data
Most organizations struggle with workforce data living in isolated systems. Recruitment metrics, time-to-fill, cost-per-hire, source effectiveness, scatter across your applicant tracking system and email threads. Retention and turnover data sit in spreadsheets, updated quarterly if at all. Compensation analysis requires weeks of manual data extraction from payroll systems. Employee engagement scores remain siloed from headcount and performance information. Sound familiar?
Consider these specific pain points:
- No real-time visibility: Dashboards become outdated before they’re shared, making it impossible to respond quickly to staffing shortages or turnover spikes.
- Inconsistent KPI definitions: Each department calculates “turnover” differently, making enterprise-wide comparisons impossible and creating conflicting narratives to leadership.
- Manual consolidation overhead: HR analysts spend days pulling data from five or more systems, increasing error risk and delaying decision-making.
- Lack of drill-down capability: Excel reports show aggregate numbers but can’t explain why turnover spiked in the engineering department or which job family has the longest hiring cycle.
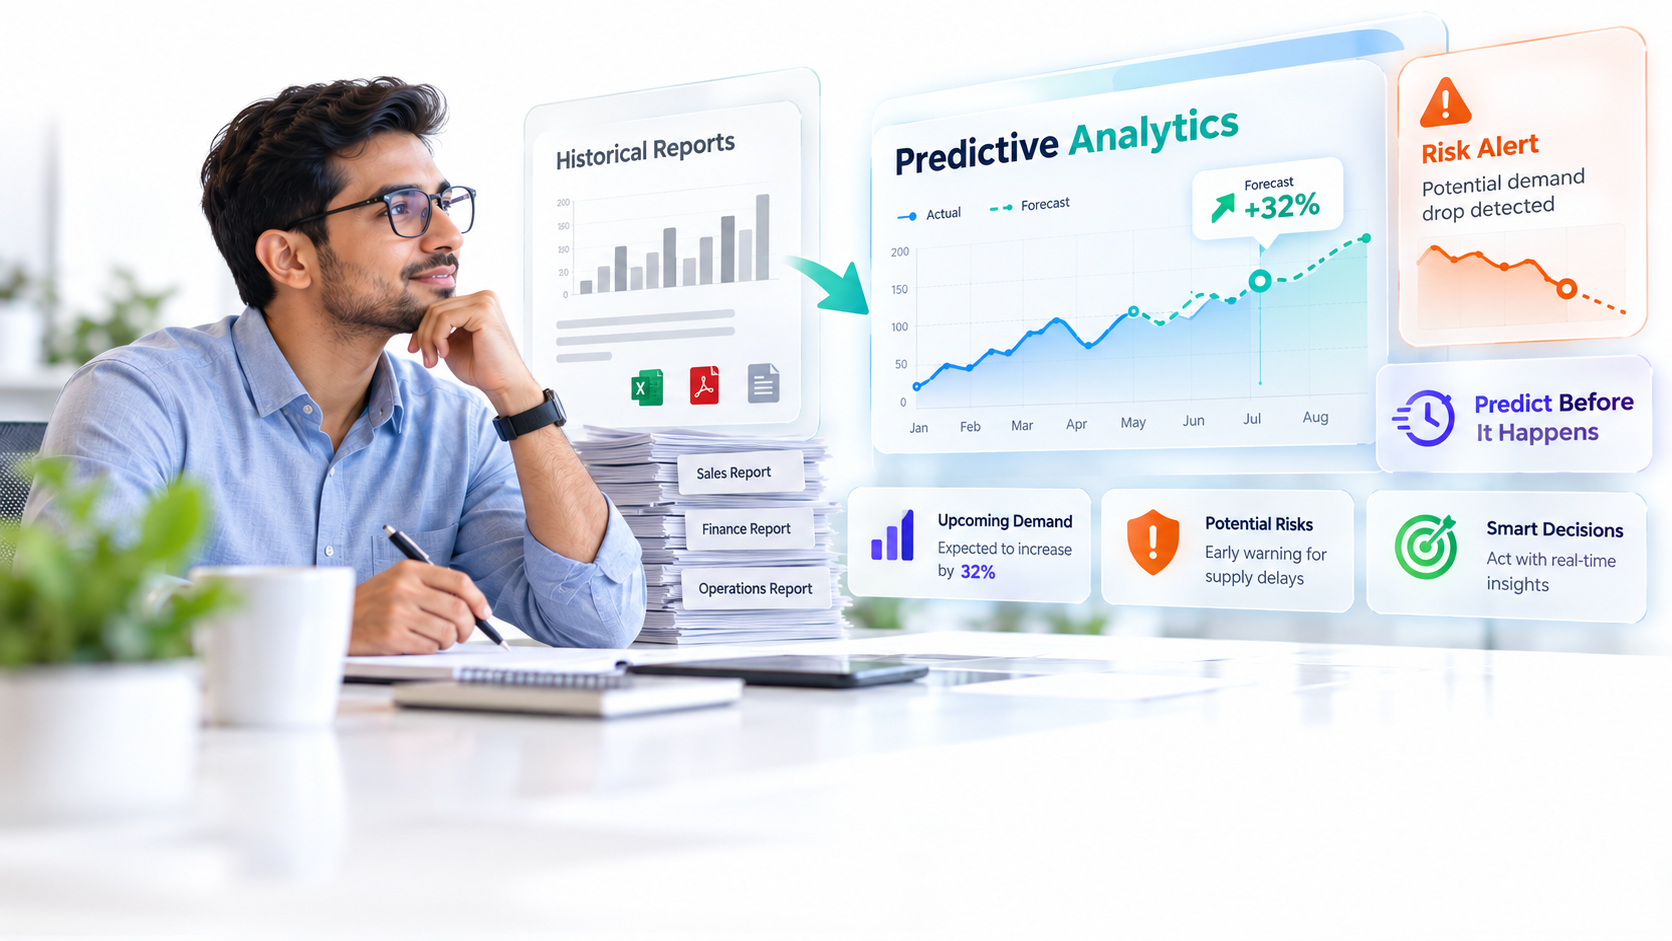
- Missing predictive insights: Without structured data models, HR can’t identify flight-risk employees, forecast hiring needs, or benchmark compensation equity trends.
- Audit and compliance gaps: Fragmented data makes it difficult to prove regulatory compliance, pay equity audits, or EEO reporting, or support HR decisions with documented evidence.
Without unified HR analytics templates, HR teams can’t respond strategically to talent risks. They can’t justify budget requests to finance. They can’t align workforce strategy to business goals because the data to make that case simply doesn’t exist in a usable form.
The Solution: HR Analytics Templates and Dashboards
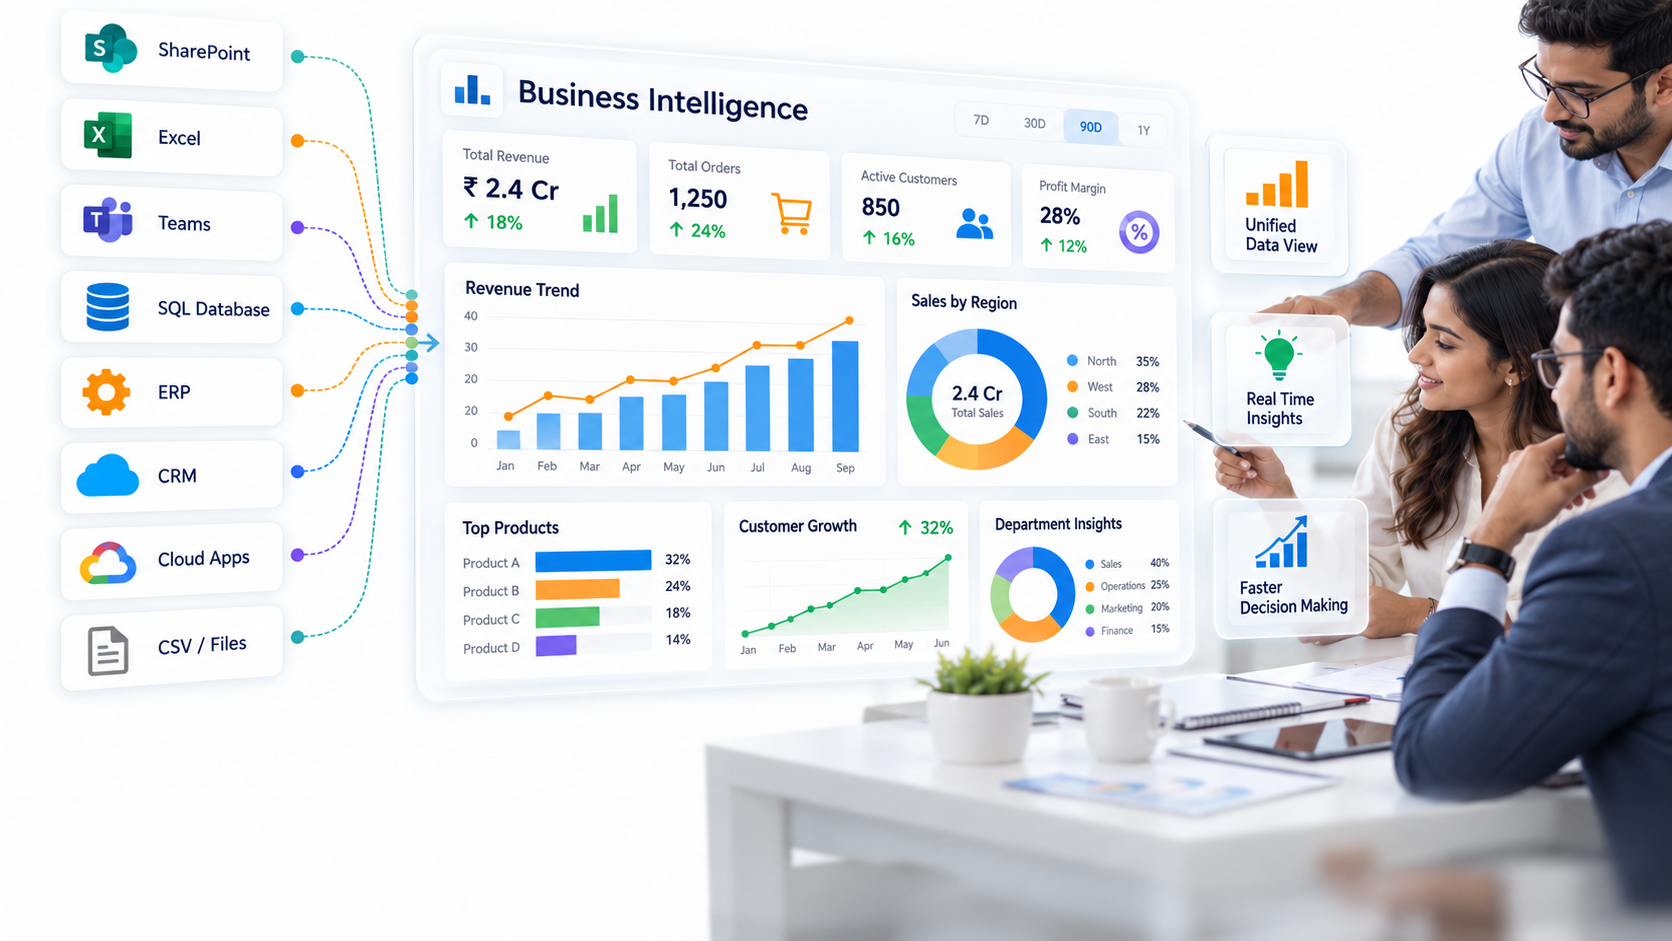
HR analytics templates solve each fragmentation challenge by creating a standardized, connected data model. The right template framework connects your ATS, HRIS, and payroll systems into one unified dashboard. This eliminates manual consolidation, standardizes KPI definitions, and enables real-time updates.
Expert Perspective
The best HR analytics templates balance “out-of-the-box” functionality with deep customization flexibility. You want templates that reflect HR industry best practices but adapt to your specific business model, industry, and strategic priorities. Templates without customization feel generic. Dashboards without templates require months of custom development.
Here’s how the right HR analytics template framework addresses core pain points:
- Unified data model: Connects ATS, HRIS, payroll, and engagement platforms into one source of truth. Eliminates manual data consolidation.
- Standardized KPIs: Pre-built metrics ensure consistent definitions across all reports. Finance and HR speak the same language about cost-per-hire.
- Real-time updates: Automated data refreshes mean dashboards reflect current reality, enabling rapid response to staffing changes.
- Visual storytelling: Charts, trends, and drill-down capability make patterns obvious to non-technical stakeholders. Executives understand trends without statistical training.
- Scalability: Add new data sources or custom KPIs without redesigning from scratch. Templates grow with your organization.
- Audit and compliance: Built-in governance, version control, and calculation documentation ensure data accuracy and regulatory compliance.
When evaluating HR analytics templates, look for these critical features:
- Pre-built connectors: Native integrations to common HR systems (Workday, SAP SuccessFactors, BambooHR, Greenhouse, ADP). Avoid solutions requiring custom SQL or middleware.
- Flexible customization: Ability to add custom fields, calculations, and visuals without rebuilding the entire dashboard structure.
- Role-based access: HR manager dashboards differ from executive summaries. The same underlying data, filtered for different audiences.
- Export and drill-down: Export capability for deeper analysis. Drill-down from annual trends to individual hiring manager performance.
- Mobile responsiveness: Dashboards viewable on mobile devices, not just desktop. Modern workforce operates everywhere.
Beyond those basics, seek templates with built-in best practices for HR metrics. A mature template library includes pre-configured recruitment funnels, turnover segmentation by department and tenure, pay equity analysis, and succession pipeline visualization. This accelerates time-to-insight and ensures you’re tracking metrics that actually drive talent decisions.
Core HR Metrics Every Workforce Dashboard Should Track
A comprehensive HR analytics template covers four primary metric domains: recruitment, retention, compensation, and engagement. Let’s explore what each domain should measure.
Recruitment and Staffing Metrics
Recruitment dashboards track hiring efficiency and effectiveness. Time-to-fill measures how long vacancies remain open, by role and department. Cost-per-hire divides total recruitment spend by number of hires, revealing which channels (job boards, agencies, referrals) deliver the best ROI. Offer acceptance rate and hiring funnel visualization show where candidates drop during the interview process. These metrics answer critical questions: Are we hiring fast enough? Which roles are hardest to fill? Which sourcing channels work best?
Retention and Turnover Metrics
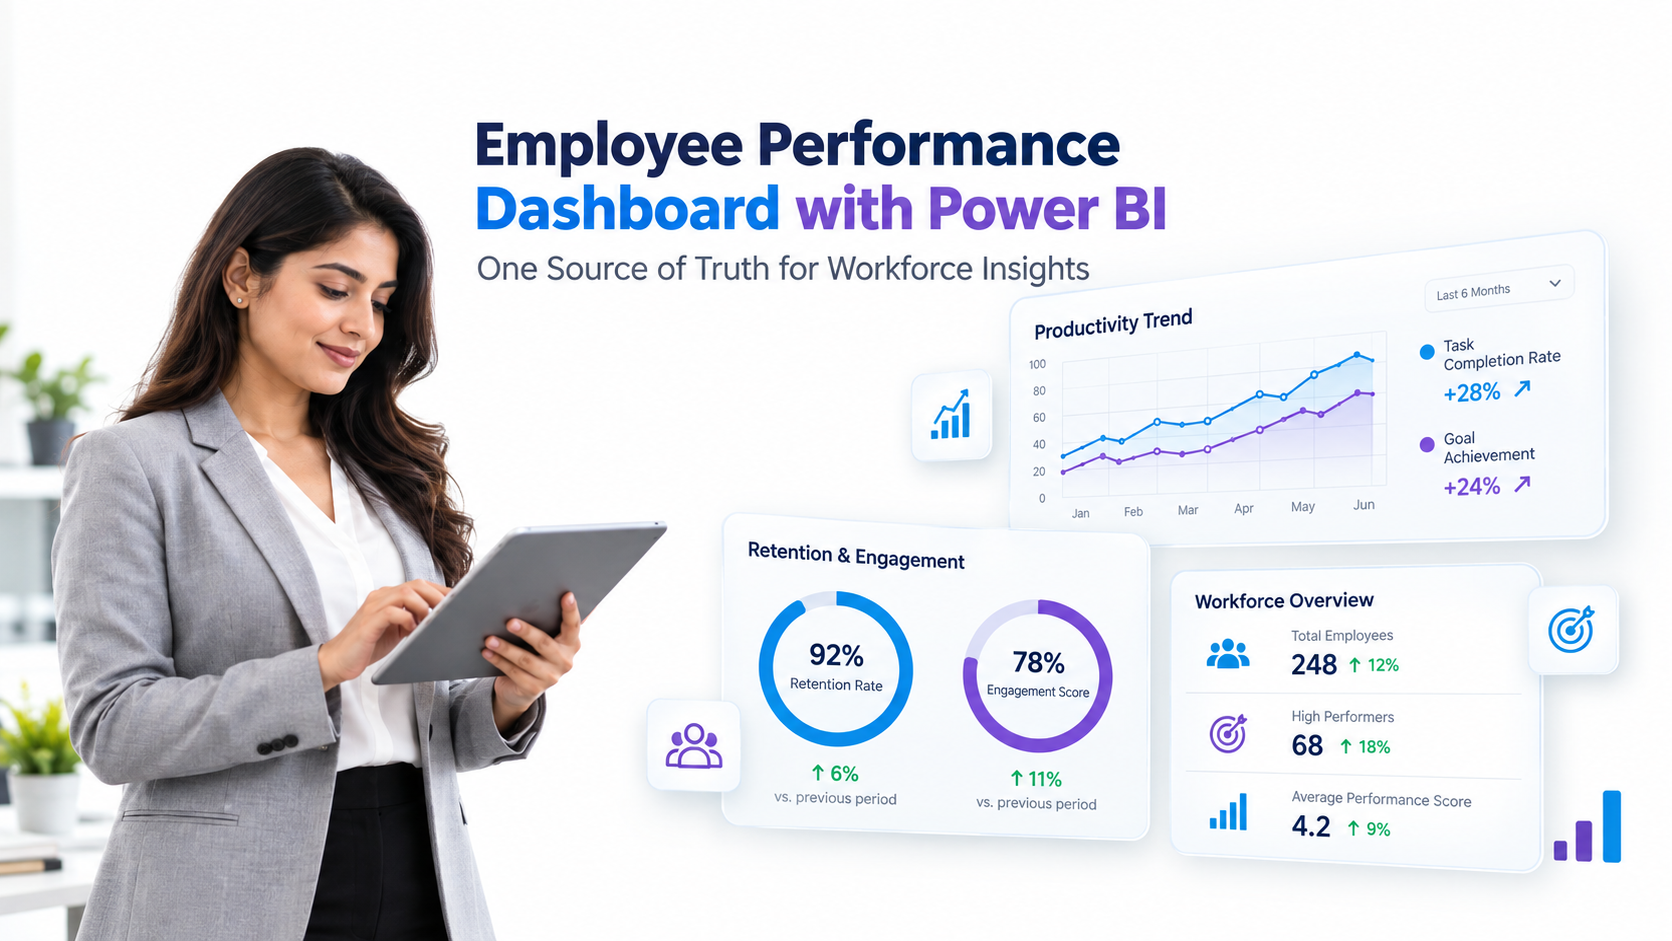
Retention dashboards distinguish voluntary turnover (resignations) from involuntary (terminations), revealing talent strategy effectiveness. Turnover by department, tenure, and manager surfaces patterns. A manager with 40% annual turnover signals management or role-fit problems. Retention rate over time shows whether initiatives are working. Flight risk segmentation uses historical patterns to identify high-risk employees, enabling proactive retention conversations before they leave.
Compensation and Equity Metrics
Compensation dashboards visualize headcount by salary band and department, revealing pay distribution. Pay equity ratio analysis, comparing average pay by gender, ethnicity, or tenure, exposes systematic gaps. Compensation growth year-over-year tracks merit increase patterns and identifies compression at senior levels. These metrics directly support compliance reporting and internal equity audits.
Engagement and Culture Metrics
Engagement dashboards track employee satisfaction and development. Employee engagement score trends show whether culture initiatives are resonating. Training hours and participation by department reveal investment in skill development. Internal promotion rate and succession pipeline strength forecast leadership bench depth. These metrics connect workforce experience to retention and productivity outcomes.
Operational Efficiency Metrics
Beyond people metrics, strong HR analytics templates track operational performance. HR operational metrics measure time spent in recruiting, onboarding, and performance management. Cost per employee (total HR spend divided by headcount) benchmarks HR efficiency. Automation metrics track how many requisitions flow through the system without manual intervention. These metrics justify HR technology investment and identify automation opportunities.
Industry Applications: Real-World Use Cases
Finance and Banking
Financial institutions face strict compliance requirements and competitive talent markets for specialized roles. HR analytics templates in finance monitor compliance-critical headcount in regulated functions. Pay equity analysis ensures gender and ethnicity parity across geographies, supporting regulatory audits. Turnover tracking in specialized roles (actuaries, risk managers) reveals bench strength and succession risks. Real-world example: a multinational bank uses HR analytics templates to forecast talent gaps in regulatory roles 18 months in advance, reducing recruitment timeline pressure.
Healthcare and Pharmacy
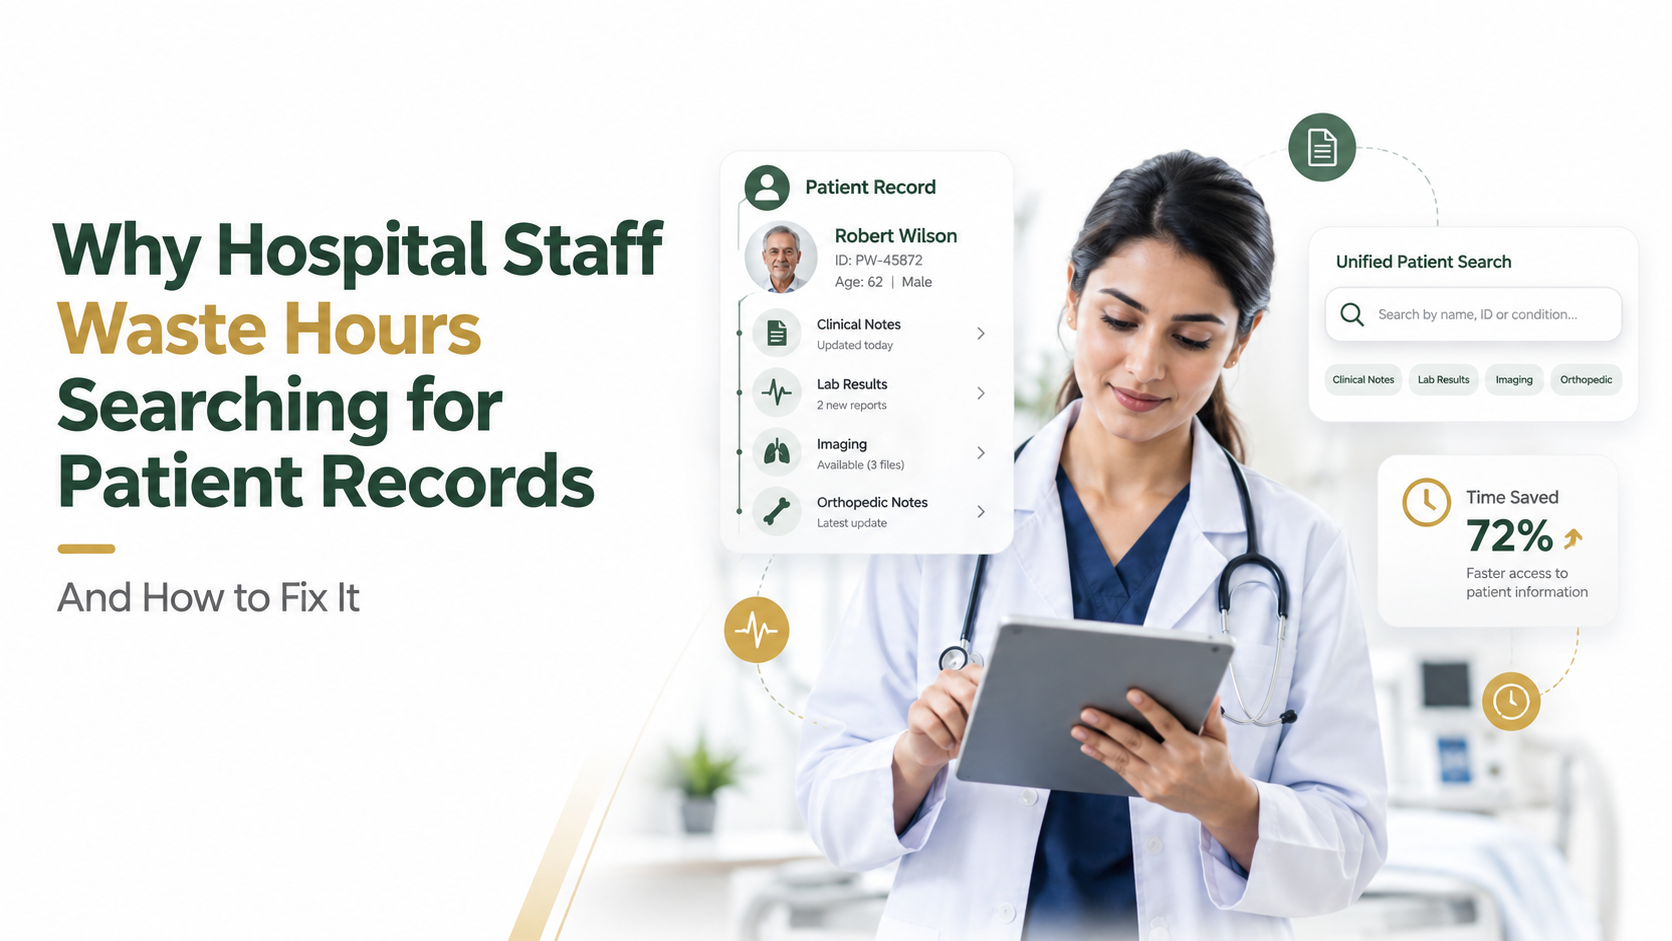
Healthcare organizations struggle with clinical staffing complexity and seasonal turnover. HR analytics templates track clinical versus administrative staffing ratios and nurse turnover seasonality. Vacancy cost analysis reveals financial impact of unfilled clinical positions. Workforce productivity dashboards correlate staffing levels with patient outcomes and satisfaction. Real-world example: a hospital system uses HR analytics templates to optimize nursing schedules against expected patient volume, reducing agency staffing spend while improving scheduling consistency.
Technology and Software
Tech companies compete fiercely for engineering talent and face rapid growth scaling challenges. HR analytics templates monitor engineering retention and time-to-productivity metrics for new hires. Hiring pipeline forecasting compares recruitment pace against growth targets. Compensation benchmarking reveals pay competitiveness against market rates. Real-world example: a growth-stage SaaS company uses HR analytics templates to identify bottlenecks in its engineering hiring funnel, discovering that interview-to-offer conversion is 40% lower than industry benchmark, prompting interview process redesign.
Retail and Hospitality
Retail and hospitality face persistent wage-and-hour challenges and high hourly turnover. HR analytics templates analyze store-level turnover drivers and correlate staffing levels with customer satisfaction scores. Wage equity analysis reveals unexplained pay differences. Schedule optimization dashboards match staffing to demand. Real-world example: a retail chain uses HR analytics templates to identify that stores with higher manager tenure have 25% lower turnover, triggering manager development and succession planning initiatives.
How to Get Started with HR Analytics Templates
Implementing HR analytics templates follows a structured path. Start by understanding your current data landscape, then define KPIs, select templates, customize them, and train your team.
Step 1: Audit Your Data Sources
Action: Inventory all systems where workforce data lives: ATS, HRIS, payroll, LMS, engagement platforms, performance management tools. Document data flows and update frequency. Outcome: Clear picture of data landscape, integration requirements, and data quality gaps.
Step 2: Define Your KPI Framework
Action: Meet with HR leadership and business stakeholders. Identify which metrics drive hiring decisions, budget approvals, and executive communication. Align on priorities: recruitment efficiency, retention risk, or compensation equity. Outcome: Shared understanding of success metrics and reporting cadence (daily, weekly, monthly, quarterly).
Step 3: Select HR Analytics Templates
Action: Evaluate template libraries using Gartner Magic Quadrant research and vendor comparisons. Prioritize solutions with connectors to your existing systems. Test templates with sample data to verify they address your KPI needs. Outcome: Foundation dashboard suite ready to customize.
Step 4: Map Data and Customize Templates
Action: Connect your data sources to selected templates. Adjust field mappings, calculations, and visuals to match your KPI definitions and branding. Add custom calculations for metrics unique to your business. Outcome: Functional, branded dashboards reflecting your organization’s metrics and terminology.
Step 5: Test, Train, and Launch
Action: Validate data accuracy by comparing dashboard values to source systems. Train HR team and business stakeholders on dashboard navigation, interpretation, and how to act on insights. Establish data governance protocols and dashboard ownership. Outcome: Organization-wide adoption of HR analytics templates as the source of truth for workforce decisions.
Frequently Asked Questions
What’s the difference between HR reporting dashboards and people analytics dashboards?
HR reporting dashboards focus on operational metrics: headcount, hires, turnover, compliance data. People analytics dashboards layer in predictive insights: flight risk identification, succession bench strength, pay equity trends, and retention drivers. Mature organizations implement both, using operational dashboards for day-to-day management and analytics dashboards for strategic workforce planning.
Can I use HR analytics templates if I don’t have a dedicated data team?
Absolutely. Modern HR analytics templates are designed for HR professionals, not data engineers. Pre-built connectors and drag-and-drop customization minimize technical barriers. That said, designating someone accountable for data quality, dashboard maintenance, and governance is critical. This person becomes the “dashboard owner,” responsible for validating data accuracy and ensuring stakeholders understand metric definitions.
How often should I refresh HR analytics templates?
Core recruitment and turnover dashboards should refresh daily or weekly, matching hiring cycle velocity. Strategic dashboards like pay equity analysis and succession planning can refresh monthly or quarterly, aligned to decision-making frequency. The refresh cadence should match how quickly you need to act on the insights.
What HR systems integrate best with analytics templates?
Major HRIS platforms (Workday, SAP SuccessFactors, ADP, and BambooHR) have native connectors to most analytics solutions. ATS systems (LinkedIn Recruiter, Greenhouse, Lever) and payroll platforms (ADP, Guidepoint) integrate widely. Smaller or legacy systems may require middleware or custom connectors. Always verify integration compatibility before selecting a template solution.
How do I ensure data accuracy in my HR analytics dashboards?
Implement data governance: standardize field definitions, conduct regular audits comparing dashboard values to source systems, establish access controls, and assign owner accountability. Document calculation logic and assumptions. Create user feedback loops so stakeholders flag inaccuracies quickly. Most data issues stem from misunderstood definitions, not technical problems, making clear communication essential.

How do I convince leadership to invest in HR analytics templates?
Lead with business impact. Quantify time currently spent on manual reporting, then calculate freed-up capacity (if 40 hours monthly go to reporting, that’s $20K+ annually in HR labor). Show how real-time dashboards enable faster hiring decisions, reducing time-to-fill by weeks and associated opportunity costs. Demonstrate pay equity risks or succession gaps that strategic dashboards would surface. Frame templates as enabling data-driven HR, not just reporting automation.
Ready to Simplify Your Workforce Reporting?
HR analytics templates transform workforce reporting from a time-consuming manual process into strategic, real-time insight. Whether you’re streamlining recruitment reporting, monitoring retention trends, or building a comprehensive people analytics platform, the right template foundation accelerates time-to-value and enables data-driven talent decisions. Let’s explore how to implement HR analytics templates that fit your organization’s unique needs and priorities.