Hospital Operations Power BI Dashboard: Templates, Examples and KPIs
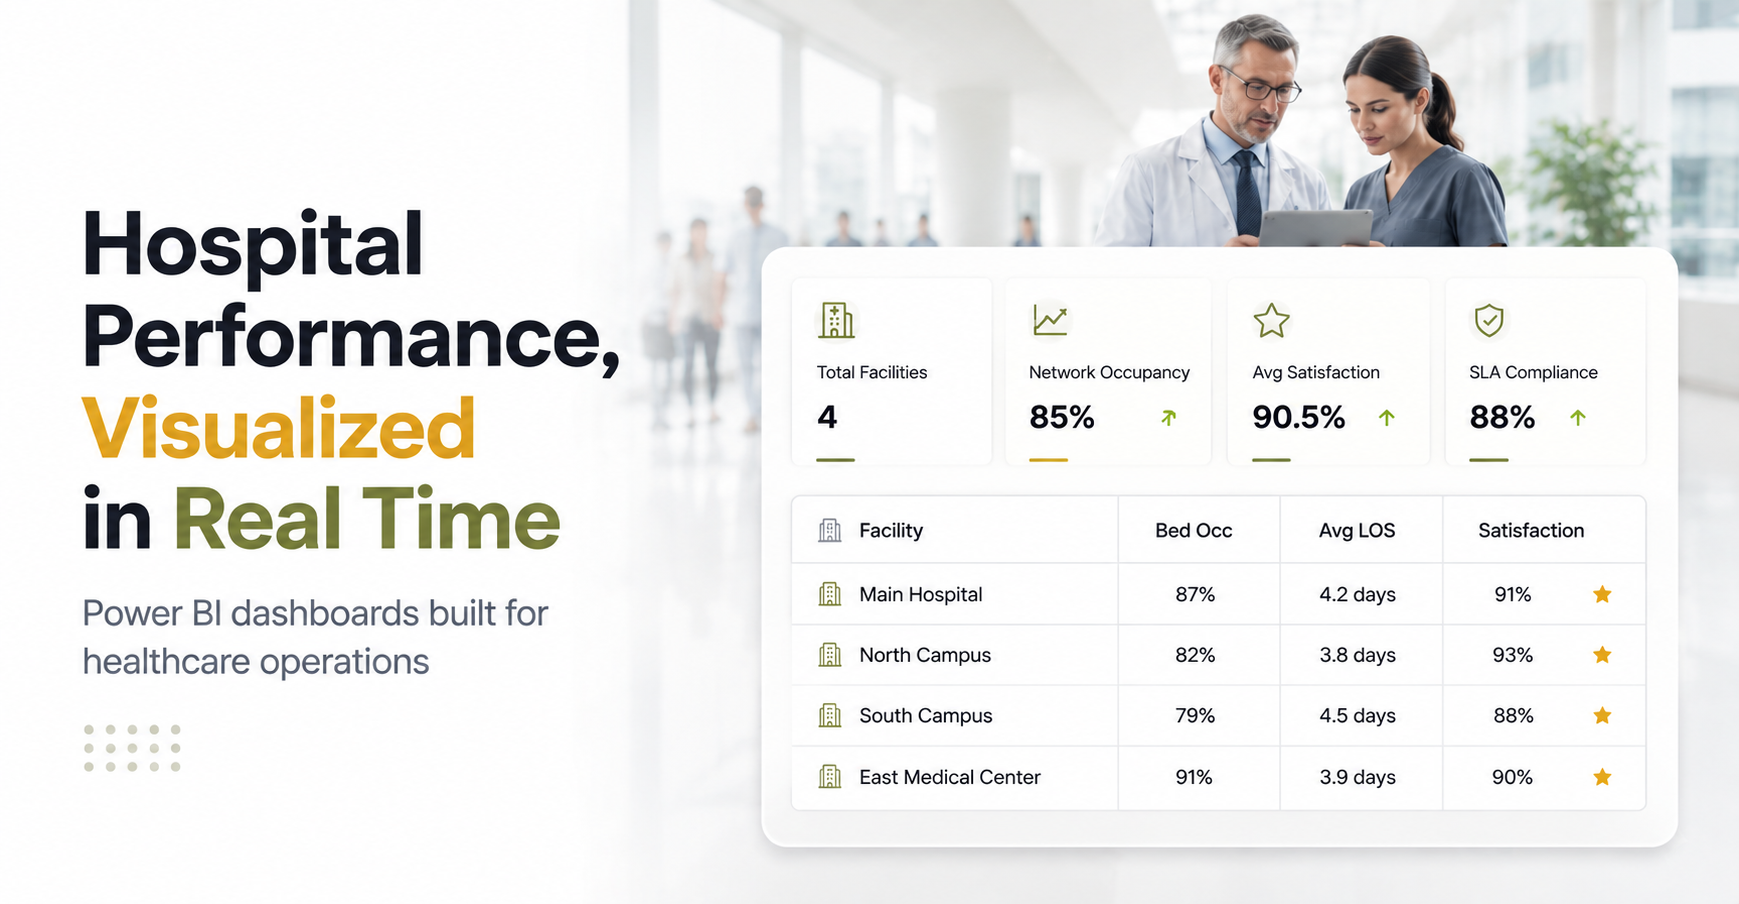
Hospital operations Power BI dashboards transform how healthcare leaders monitor performance, reduce manual reporting, and make data-driven decisions. Instead of spending 10+ hours compiling data from multiple sources into spreadsheets, operations teams now access real-time insights with a single click. The right dashboard consolidates fragmented data, enables faster decision-making, and helps hospitals identify bottlenecks in ED throughput, OR utilization, bed turnover, and staffing efficiency.
Key Takeaway
A well-designed hospital operations Power BI dashboard can reduce operational reporting time by 70, 80% and give leadership instant visibility into critical KPIs like ED wait times, OR utilization, and bed turnover rates.
In This Article
- Why Hospital Operations Managers Need Real-Time Dashboards
- Core Hospital Operations Challenges
- The Solution: Hospital Operations Power BI Dashboards
- Key Hospital Operations KPIs to Track
- Real-World Power BI Dashboard Examples
- Power BI Features That Matter for Hospital Operations
- How to Get Started with a Hospital Operations Dashboard
- Frequently Asked Questions

Why Hospital Operations Managers Need Real-Time Dashboards
Healthcare is shifting from reactive to proactive operations management. Hospitals investing in real-time operational analytics see measurable improvements in efficiency, patient flow, and financial performance. The stakes are high: bed shortages, staffing costs, and patient throughput challenges drive demand for better operational visibility every single day.
According to HIMSS research on healthcare digital transformation, hospitals with real-time operational dashboards improve ED throughput metrics and reduce average length of stay. Manual reporting, spreadsheets, and siloed data systems prevent operations teams from responding quickly to emerging bottlenecks. When leadership lacks real-time insight, small inefficiencies compound into significant operational and financial losses.
“Hospitals with real-time operational dashboards reduce ED wait times and improve bed utilization, directly impacting both patient satisfaction and operational costs.”
Healthcare Information and Management Systems Society (HIMSS), 2023
On top of that, hospital operations Power BI dashboards democratize data access. Clinical and operational staff no longer wait for IT to generate monthly reports. Frontline teams can answer their own questions, drill down into trends, and escalate issues before they become crises.
Core Hospital Operations Challenges (Without Real-Time Dashboards)
Without a centralized dashboard, hospital operations teams face recurring pain points that drain time and delay decision-making:
- Manual, error-prone reporting consuming 10+ hours per week across multiple team members
- Fragmented data sources: EHR systems, billing platforms, staffing management tools, and supply chain databases don’t communicate, creating conflicting metrics
- Delayed insights: Reports are historical, not real-time, so leaders can’t react to ED boarding delays or OR scheduling conflicts until the next day
- Lack of drill-down capability: Leaders see summary numbers but can’t quickly investigate why length of stay spiked or why ED LWBS (left-without-being-seen) rates increased
- Compliance and security risks: Operational data scattered across unsecured spreadsheets with no audit trails or row-level access controls
- Poor adoption and trust: When different departments pull data from different sources, leadership questions the accuracy of operational insights
And here’s the thing: these challenges cascade. Inefficient bed turnover, prolonged ED wait times, and overstaffing or understaffing directly reduce patient satisfaction and financial performance. Hospitals miss opportunities to optimize patient flow, anticipate staffing shortages, and reduce costly supply chain waste. Hospital operations Power BI dashboards address each of these pain points head-on.
The Solution: Hospital Operations Power BI Dashboards
The right hospital operations Power BI dashboard transforms data into actionable intelligence. Here’s how the best solutions solve the core operational challenges:
- Automated data aggregation reduces manual reporting by 70%+ and eliminates human error in data entry
- Centralized source of truth eliminates siloed data and conflicting metrics across departments
- Real-time refresh capabilities enable proactive decision-making instead of reactive firefighting
- Drill-down and filtering features allow root cause analysis in minutes, not days
- Role-based access and row-level security (RLS) maintain HIPAA compliance while giving each user appropriate data visibility
- Mobile optimization ensures leadership and clinical staff can check dashboards during rounds, meetings, and standups
That said, building a successful hospital operations Power BI dashboard requires more than technical skills. Success depends on clear objectives, solid data integration, and genuine user adoption. The dashboard itself is a tool. The real value comes from how operations teams use it to drive change.
Expert Perspective
When designing a hospital operations dashboard, involve clinical and operational staff early in the design process. The best dashboards are co-created with the people using them daily, not imposed by IT alone. End-users should validate every KPI, visual, and drill-down path before the dashboard goes live.
Worth noting: look for a partner or consultant with experience integrating healthcare data sources, understanding of hospital workflows, HIPAA compliance expertise, and commitment to post-implementation support. Successful hospital operations Power BI implementations involve ongoing training, feedback loops, and iterative refinement.
Key Hospital Operations KPIs to Track in Hospital Operations Power BI Dashboards
A comprehensive hospital operations Power BI dashboard monitors KPIs across multiple operational domains. Prioritize metrics that directly influence patient flow, financial performance, and compliance:
ED and Throughput Metrics: ED arrival rate, triage-to-provider time, left-without-being-seen (LWBS) percentage, ED boarding time, and patient disposition rates reveal how efficiently the emergency department moves patients to inpatient beds or discharge. These directly impact patient satisfaction and safety.
Bed Management Metrics: Bed turnover rate, average length of stay (LOS), same-day discharge percentage, and bed utilization percentage show whether the hospital is moving patients efficiently through the system. Higher turnover and lower LOS generally indicate better operational efficiency.
OR and Surgery Metrics: OR utilization percentage, case duration variance, first-case-on-time percentage, and OR turnaround time reveal surgical productivity. Even 5-minute improvements in OR turnover times, multiplied across 20+ daily cases, dramatically improve financial performance.
Staffing Metrics: RN-to-patient ratio, nursing hours per patient day (HPPD), staff scheduling efficiency, and call-in rate directly affect labor costs and patient safety. Hospitals track these closely to maintain compliance with staffing standards and union agreements.
Supply Chain Metrics: Inventory turnover, cost per patient day, and stockout incidents reveal supply chain efficiency. Hospital supply costs represent a significant portion of operational expense, making this visibility critical.
Patient Outcomes and Financial Metrics: Readmission rate, mortality rate, patient satisfaction scores (HCAHPS), revenue per bed, expense per bed, and payer mix connect operational efficiency to quality and financial outcomes. These metrics demonstrate value to leadership and board members.

Real-World Power BI Dashboard Examples for Hospitals
Understanding how other hospitals structure their dashboards helps teams design solutions suited to their specific workflows. Here are four practical examples:
ED Operations Dashboard
This hospital operations Power BI dashboard displays arrival trends, triage-to-provider time, boarding hours, and LWBS percentage in a single view. Real-time visuals show current ED census by acuity level. Users can drill down by department, shift, and patient acuity to identify specific bottlenecks. Red, yellow, green alert thresholds trigger when wait times exceed targets, enabling immediate escalation.
OR Utilization Dashboard
A surgical dashboard compares scheduled versus actual case times, room turnover metrics, first-case-on-time percentage, and surgeon and specialty-level performance. Filtering capabilities allow surgical leadership to analyze trends by surgeon, specialty, or time period. This visibility helps identify scheduling patterns, support surgeon productivity, and optimize block time allocation.
Bed Management Dashboard
This hospital operations Power BI dashboard shows current bed census by unit, LOS distribution, discharge forecast, and bed turnover rate. Color-coded occupancy levels and alerts highlight units approaching capacity or outlier LOS cases requiring clinical intervention. Trend analysis helps predict discharge patterns and bed availability for elective admissions.
Staffing and Scheduling Dashboard
A staffing dashboard displays current FTE allocation, scheduled versus actual hours, overtime percentage, call-in rate, and nurse-to-patient ratios by unit. Variance from staffing targets appears immediately, enabling rapid adjustments to schedule or resource allocation. Historical trends support workforce planning and budget forecasting.
In every example, visual design emphasizes clean, intuitive layouts with minimal scrolling. Mobile optimization ensures leadership and clinical staff can access dashboards from tablets during rounds. Drill-down capabilities enable root cause analysis without overwhelming users with excessive data on the initial view.
Power BI Features That Matter for Hospital Operations
Not all analytics platforms offer the same capabilities. Hospital operations teams should prioritize these Power BI features when evaluating solutions:
- Real-time data refresh and streaming datasets ensure dashboards reflect current operational conditions, not yesterday’s data
- Row-level security (RLS) maintains HIPAA compliance by controlling which users see which data based on their role and unit
- Mobile app optimization allows leadership and clinical staff to check KPIs from tablets and phones during patient rounds or meetings
- Paginated reports support compliance requirements and historical archiving in formats suitable for regulatory submissions
- Integration with Azure healthcare data compliance features ensures data residency and encryption meet healthcare privacy standards
- Native connectors for major EHR and healthcare systems (Epic, Cerner, Medidata) simplify data integration and reduce IT overhead
- Advanced filtering, drill-down, and Q&A natural language queries empower end-users to answer questions without waiting for IT support
- Scheduled alerts and email notifications trigger when KPI thresholds are breached, enabling rapid operational response
These features work together to create dashboards that are both powerful and user-friendly. Plus, Power BI’s cloud-based architecture means updates and new features roll out automatically, keeping your hospital operations dashboard current without IT maintenance burden.
How to Get Started with a Hospital Operations Power BI Dashboard
Implementing a hospital operations Power BI dashboard follows a clear, structured process. Here’s how to move from concept to operational reality:
Step 1: Define Objectives and Stakeholders
Meet with operations, clinical, and IT leadership to identify the top 3, 5 business problems the dashboard should solve. Establish governance, data ownership, and success metrics early. Include end-users (frontline operations staff, nursing leaders, surgical directors) in planning conversations. Outcome: Clear hospital operations Power BI dashboard requirements and stakeholder buy-in across departments.
Step 2: Assess Data Sources and Integration
Map all operational data sources (EHR, billing, staffing management, supply chain). Identify data quality issues and compliance requirements. Plan your data integration strategy, including API connections, SQL Server integration, and cloud infrastructure. Outcome: A detailed data architecture and integration roadmap that your IT team can execute.
Step 3: Design the Dashboard with End-Users
Co-create mockups and wireframes with operational staff who’ll use the dashboard daily. Focus on KPIs that drive decisions, not vanity metrics. Prioritize simplicity and mobile usability. Plan for drill-down capability and filtering options that support root cause analysis. Outcome: An approved dashboard design validated by actual end-users before a single line of code is written.
Step 4: Build and Test in Power BI
Develop the hospital operations Power BI dashboard in Power BI Desktop and publish to Power BI Service. Test data accuracy, query performance (especially with large historical datasets), and row-level security. Pilot with a small group of operations staff and gather feedback. Outcome: A validated, production-ready dashboard ready for broader deployment.
Step 5: Deploy and Provide Ongoing Support
Roll out the dashboard to broader operations teams. Provide training, user guides, and embedded support for questions. Monitor adoption and refine based on feedback. Schedule regular check-ins to identify new KPIs or dashboards needed as operational priorities shift. Outcome: Full operational adoption, continuous improvement, and sustained ROI from your hospital operations Power BI investment.
Plus, successful implementations recognize that the dashboard is a starting point, not a final solution. Healthcare operations evolve constantly. Your dashboard should evolve with them through regular refinement and stakeholder feedback loops.
Frequently Asked Questions
Can Power BI integrate with our EHR system like Epic or Cerner?
Yes. Power BI has native connectors and APIs for major EHR platforms including Epic, Cerner, Medidata, and others. Integration requires IT coordination, careful data mapping, and governance planning, but it’s a standard pattern in modern healthcare. Your IT team and EHR vendor should collaborate on the integration approach.
Is a Power BI hospital operations dashboard HIPAA-compliant?
Power BI can be HIPAA-compliant when deployed on Azure with proper security controls, row-level security, data encryption, and audit logging. Make sure your underlying data sources are also compliant and that dashboards don’t unnecessarily expose protected health information (PHI). Work with your compliance and IT teams to validate the overall architecture meets your regulatory requirements.
How much historical data should we retain in the hospital operations Power BI dashboard?
Real-time dashboards typically show 1, 3 years of rolling data for trend analysis and benchmarking. For regulatory compliance, audit trails, or specialized reporting, archive older data separately. Discuss data retention policy with your IT, compliance, and legal teams to ensure alignment with healthcare data retention standards.
Can we customize Power BI templates to match our hospital’s specific workflows?
Absolutely. Hospital operations Power BI templates are starting points, not rigid solutions. Work with your IT team or a Power BI consultant to customize visuals, KPIs, drill-down paths, and filtering options to match your hospital’s unique processes, terminology, and organizational structure. The best dashboards reflect how your hospital actually operates.
What happens if our data sources change or new systems are added?
Power BI dashboards are flexible and can adapt as your hospital’s technology environment evolves. Plan your data architecture to accommodate future system additions or replacements. Work with your IT team to maintain clear data definitions, transformation logic, and documentation so that dashboard updates are manageable. Regular governance reviews ensure the hospital operations Power BI dashboard stays aligned with your operational needs.
Transform Your Hospital Operations Today
A hospital operations Power BI dashboard reduces reporting overhead, gives leadership real-time visibility, and empowers teams to make faster, data-driven decisions. Discover how to design, build, and deploy a dashboard that works for your hospital’s unique operational challenges.