Financial leaders are under constant pressure to deliver insights fast. That’s where Power BI comes in. If you’re wondering how to build a financial dashboard in Power BI, this blog is your complete step-by-step guide. From design best practices to real-world reporting examples and mistakes to avoid — everything you need to empower smarter financial decisions is here.
Need help getting started?
Explore our Power BI Dashboard Services for customized reporting solutions.Define Your Financial KPIs
Start with key financial metrics like:
- Revenue, COGS, Gross Profit
- Net Income, EBITDA
- Cash Flow, Expense Ratio
- Budget vs Actuals
Connect to Data Sources
Use Power BI connectors for:
- Excel, SQL Server, Dynamics 365, Google Sheets
- Third-party financial systems like SAP, QuickBooks, Zoho
Data Modeling and DAX Measures
Create calculated measures using DAX:
Gross Profit = [Revenue] – [COGS]
Need help setting up data models? Talk to our Power BI consultants.
Design the Layout
Use grids for financial sections like:
- Executive Summary
- P&L and KPIs
- Trend Graphs
- Category Drilldowns
Add Slicers and Filters
Allow users to drill by:
- Time Period (Month, Quarter)
- Region/Business Unit
- Product Category


Check our Power BI dashboard examples for design inspiration.
Yes, Power BI is widely used for financial reporting. It supports: From daily ops reporting to CFO-ready board reports, Power BI handles it all.

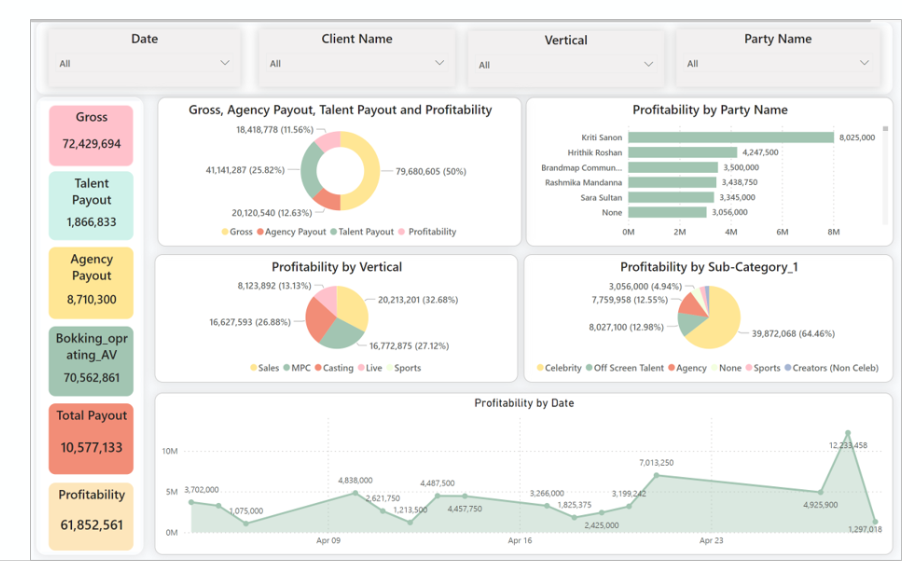
A mid-sized retail firm built a CFO dashboard with: Power BI enabled real-time updates, and interactive filtering for leadership.

Have a question? check these answers.
They use it for real-time dashboards, trend analysis, and automated reporting for revenue, expenses, and KPIs.
It’s a dashboard that visualizes country-level GDP metrics across timelines and geographies, often used by public policy or global economic teams.
Report-level filters, Page-level filters, and Visual-level filters — each determines the scope of the filtering applied.
No, unfortunately, you can’t. Microsoft needs to authenticate all users who access a SharePoint site. A Website typically requires anonymous users.
It’s a dashboard designed for CFOs that tracks metrics like P&L, revenue growth, gross margin, and cash flow trends in real time.
Use DAX: Gross Profit = [Revenue] – [COGS]
Create a custom date table with fiscal columns (month, quarter, year), then relate it to your financial fact tables.
Yes, you can use DAX and what-if parameters to create interactive financial modeling scenarios.
It refers to integrating Income Statement, Balance Sheet, and Cash Flow into a single Power BI dashboard.