

Power BI dashboards for finance and FP&A
A finance dashboard shows where cash is, who owes you, what you owe, and which budgets are running over, all on one set of numbers that finance and the business both trust. Below are the screens we have designed. We build them on your own data.
Request the sample pack
What it answers
Four questions every finance team is asked
Each screen starts from a question, not a chart. If a dashboard cannot answer its question in one glance, we change the page, not the question.
- Where do we stand on cash and spend?Revenue, EBITDA, closing cash and cash conversion, with a P&L walk from revenue to EBITDA and operating expense by department.
- Who owes us, and how late are they?Receivables by ageing bucket and region, overdue customers with their credit use, and billed against collected.
- What do we owe, and how much cash do we need?Payables by ageing bucket, purchase spend by vendor, a cash walk for the period and a 13-week cash forecast against a minimum buffer.
- Are we on budget, and how reliable is the forecast?Budget against actual by month and region, forecast accuracy, and the departments that are over budget and by how much.
The screens
Power BI finance dashboard screens
Three screens for the CFO and finance head, and three for FP&A. Open one to see it full size. Each comes with filters and drill-through, and we adjust measures, filters and branding to your business, so a screen is a starting point and not a fixed product.
6 dashboards
Every number on these screens is sample data. No client data is shown. Your own logo replaces the AscenWork mark at the top left of each report.
How we define the main finance measures
A finance dashboard is only trusted if everyone reads the same number. We agree these definitions with you before we build, and write them down at handover.
| Measure | How we calculate it | What to agree first |
|---|---|---|
| EBITDA and margin | Earnings before interest, tax, depreciation and amortisation, and that figure divided by revenue. | Which one-off items are added back. |
| DSO (days sales outstanding) | Receivables divided by revenue for the period, multiplied by the number of days. | The period used, and whether credit notes are netted off. |
| DPO (days payable outstanding) | Payables divided by purchases for the period, multiplied by the number of days. | Whether purchases or cost of sales is the base. |
| Cash conversion cycle | Days inventory plus DSO, minus DPO. | Which inventory days figure is used when there is no stock. |
| Budget variance | Actual minus budget, shown in money and as a percentage of budget. | Whether a favourable variance on cost is shown as positive or negative. |
| Forecast accuracy | One minus the absolute percentage error between forecast and actual for the period. | The forecast version to compare, such as the last one before the period closed. |
| Overdue balance | Receivables past their due date, not their invoice date. | The payment terms held for each customer. |
How it works
From these screens to your live dashboard
In a project, the dashboard connects to your own ledger and refreshes on a schedule. You see working pages early, so you react to something real.
Connect
We link your ERP, ledgers, bank data and budget files, and check the data is complete.
Model
We clean and join the data, and agree each measure with you so finance and the business read the same number.
Design
We apply your chosen look and your logo to every page, with a phone layout where it is needed.
Go live
The dashboard runs in Power BI with scheduled refresh, filters, drill-through and access by role.
What we connect
Where the data for these dashboards comes from
We confirm the sources on a short scoping call. These are the common ones for a finance dashboard.
Ledger and ERP
Your general ledger and the modules for sales, purchasing and inventory, so the numbers match what the accounts show.
Receivables and payables
Open invoices and payments, with due dates and payment terms, for ageing and days outstanding.
Budgets and forecasts
Budgets by month, department and region, and each forecast version, usually kept in Excel, SharePoint or a planning tool.
Bank and cash
Bank balances and cash movements, plus the 13-week cash forecast your treasury team keeps.
Cost centres
The department and cost-centre structure, so spend can be drawn against the right budget owner.
Access by role
Row-level security, so a department head sees their own cost centres and the CFO sees everything.
Our Power BI work
These screens are one part of what we do on Power BI
The same team builds the data model behind the dashboard, designs the report and keeps it running. Pick the part you need.
Power BI development
Data connections, model, measures, row-level security and scheduled refresh, built in your Power BI.
Power BI consulting
A review of your current reports and data, and a plan before you build.
Power BI designing
Clear, fast report design with a consistent look across every page.
Copilot and AI for Power BI
Ask questions of your data in plain language, with the right guardrails.
Case studies
Power BI projects we have delivered
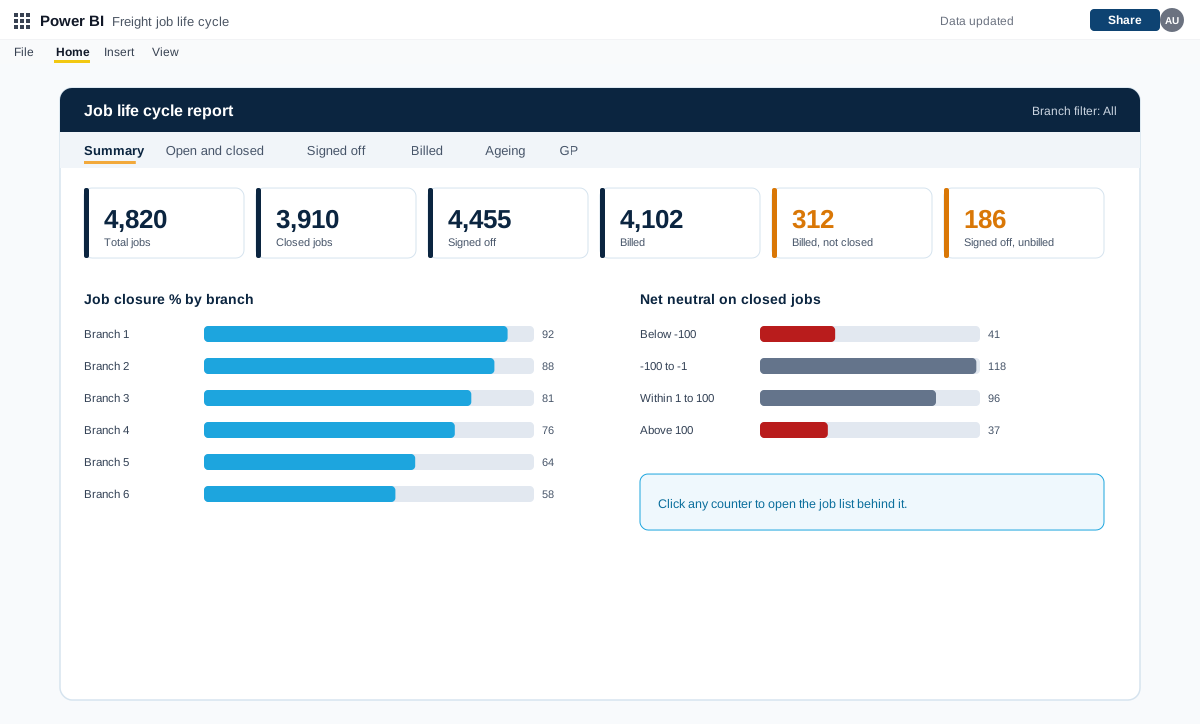
Power BI job life cycle, exception and debtors reports for a freight forwarder
A set of Power BI reports for a freight forwarding and customs clearing company with many branches. They follow every job from creation to closure and flag exceptions, pending billing, debtors and profit.
A freight forwarding and customs clearing company with many branches and a finance team at head office
Read the case study →Power BI · Energy and renewables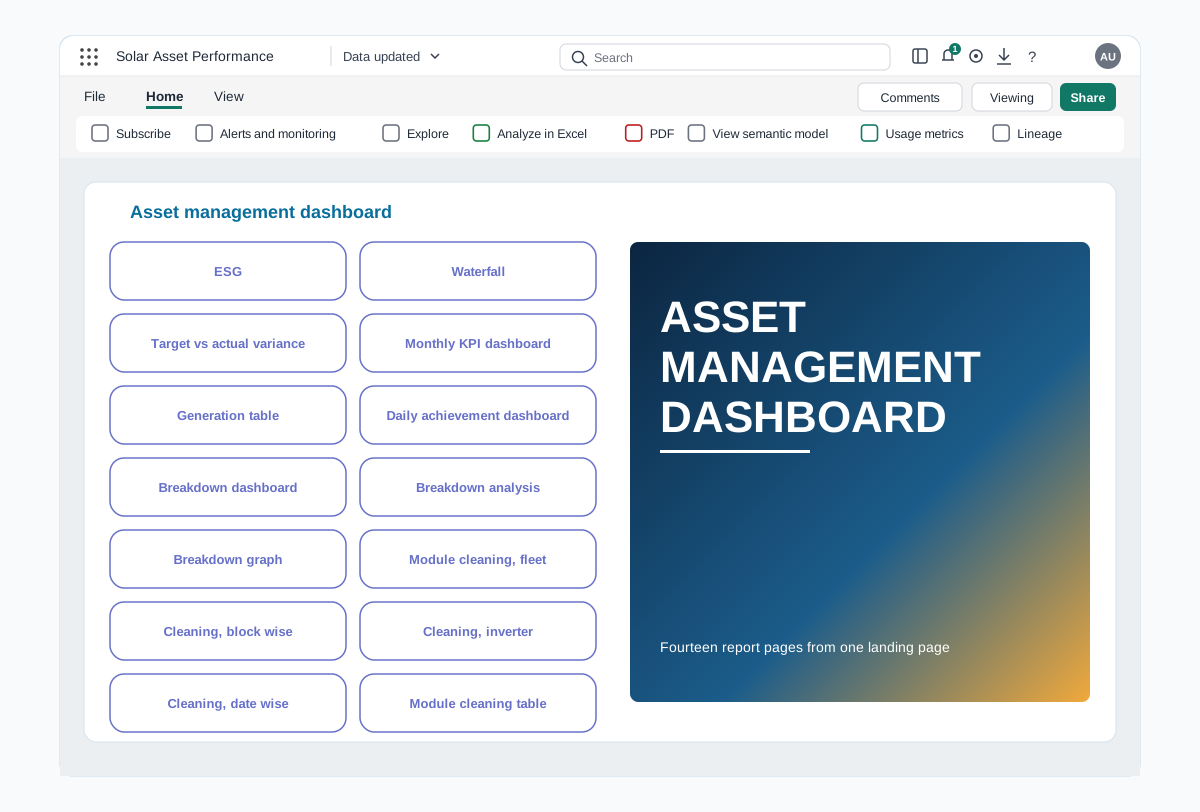
Power BI asset performance dashboards for a renewable energy portfolio
A Power BI report that follows generation, losses, breakdowns and module cleaning across every solar plant in a portfolio, from an executive summary down to the inverter.
A renewable energy company operating several solar plants
Read the case study →Power BI · Retail and consumer goods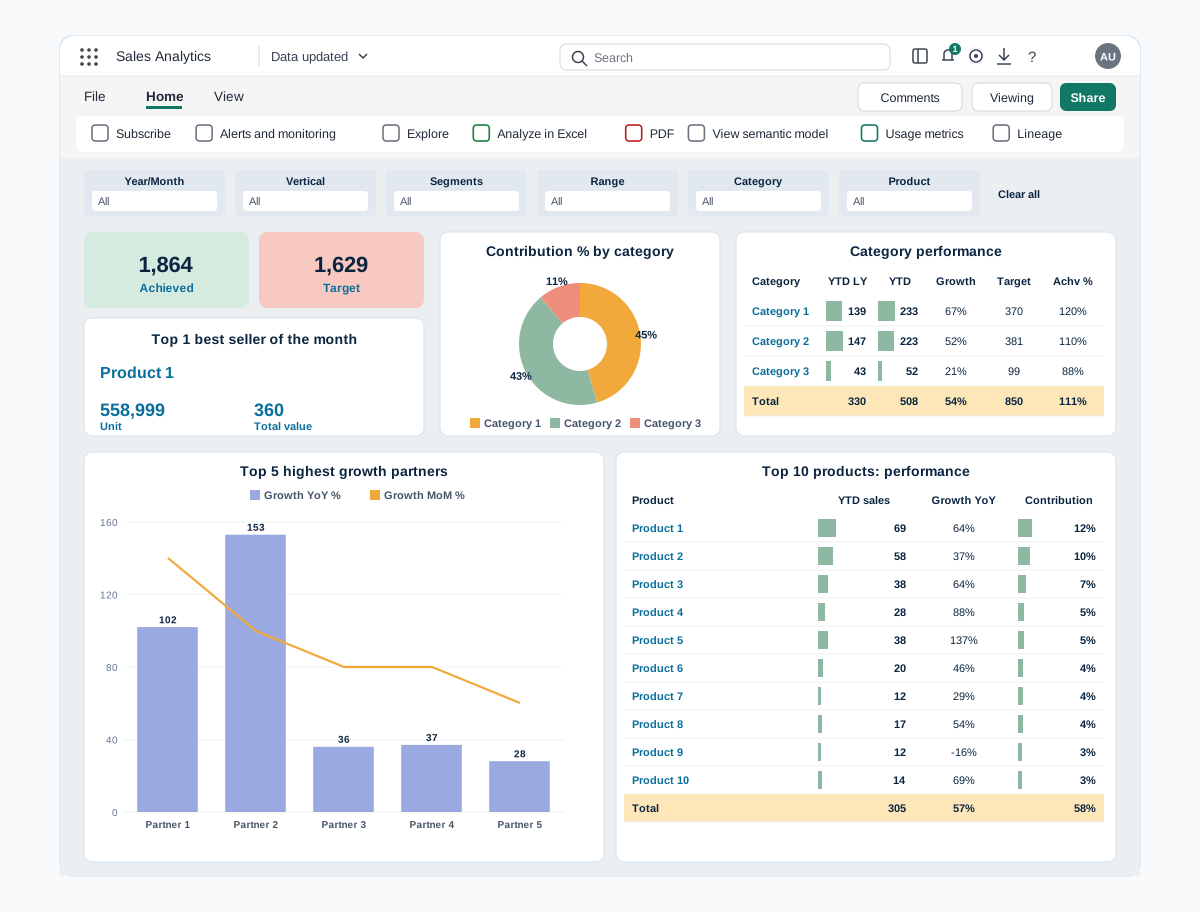
Power BI sales dashboards for digital channels and prescription sales
Two Power BI reports that bring sales data from every channel into one view. Digital sales covers partners, marketplaces, website and products, and Rx sales covers prescribers, zones, brands and field teams.
A skincare company selling through digital partners, its own website and prescription channels
Read the case study →Trusted by teams at












Power BI finance dashboard questions
What should a CFO dashboard in Power BI show?
Cash, receivables, payables, revenue and EBITDA against budget, and the open decisions that depend on them. Start with the questions the CFO asks each week and show only the figures that answer them.
What does an FP&A dashboard add?
Budget against actual by department and region, the EBITDA bridge from budget to actual, and forecast accuracy. It shows where the gap comes from, so the team can act on it before month end.
How often do the numbers refresh?
That depends on your source system and your Power BI licence. We set up scheduled refresh in the Power BI service and confirm the frequency on the scoping call.
Can it connect to our ERP and ledger?
Usually yes. Power BI connects to many ERPs and databases directly, and to Excel and SharePoint. We confirm the route for your system on a short scoping call and tell you what is easy and what needs extra work.
Are these screens real company data?
No. Every number is sample data, and no client data is shown. In a project, the same pages run on your own data.
Can each department see only its own cost centres?
Yes. With row-level security, a department head sees their own cost centres and budgets, while the finance team sees the whole organisation.
How do we agree the measures, such as DSO and EBITDA?
We write each definition down with you before we build, including which items are added back and which base is used. The definitions are then part of the handover, so the numbers stay the same over time.
Is the sample pack free?
Yes. The design pack is free, and we email it to you as a PDF. Building dashboards on your own data is a scoped, paid engagement, which we quote after a discovery call.
Related
More from our Power BI work
All dashboard templates
Fifteen dashboards by function and industry
Leadership dashboards
The CEO view and the board pack
Sales and marketing dashboards
Target, pipeline, ROAS and funnel
Power BI development
Build a dashboard on your own data
Power BI consulting
Review and plan before you build
Hire Power BI developers
Developers who join your team
Budgeting and forecasting models
Budget against actual, with forecast scenarios
Financial services
How we work with this sector
Contact