

Power BI dashboard development built on data you can trust
We connect your data sources, build a clean data model, and design the reports your teams need. Security, refresh and handover are part of the job, so the dashboard keeps working after we leave.
Trusted by teams at












What we build
What a Power BI development project covers
We scope it to your need. A single dashboard may use only some of these. A company-wide reporting set may use all of them.
Data connections
We connect Excel files, SharePoint lists, databases and business applications, and prepare the data with Power Query.
Data model
A clean data model with agreed measures, so every report shows the same figure for the same question.
Dashboards and reports
Pages that answer your questions first, with filters and drill-through that match how your teams work.
Security by role
Row-level security so a regional manager sees their region and the board sees everything.
Scheduled refresh
Refresh set up and tested, including a data gateway where your data is on your own network.
Reports where people already work
Reports shown in Microsoft Teams and on SharePoint pages, and printable paginated reports when a fixed format is needed.
How it works
How a Power BI project runs
You see working pages early, so you react to something real before the full build.
Questions and data
We agree what the dashboard must answer, who uses it, and where the data comes from.
Prototype
A first version on real data, so you can react to layout and numbers early.
Build and test
The data model, final pages, security and refresh, checked against figures you already trust.
Handover
Training for your team, the Power BI files and notes on how the model works.
What you get
Built to last after go-live
A dashboard is only useful if people keep trusting it. We build for that.
- Numbers checked against your ownWe reconcile the dashboard against figures your finance or operations team already trust.
- Clear and fast pagesThe first page shows what matters. Slow visuals are fixed before handover.
- DocumentedWhere the data comes from and how each measure is calculated, written down.
- Support after go-liveFixes, new pages and refresh checks under a support plan if you want one.
In a real project
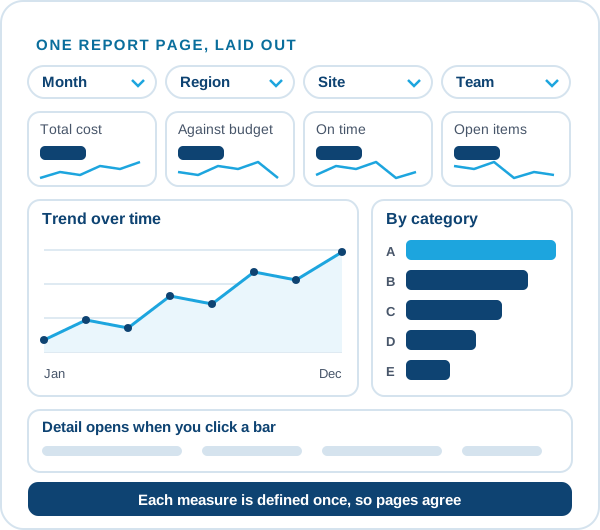
Every measure is defined once
When target, actual and variance are calculated in one place, every page of the report agrees and every person sees the same number. We build the data model first and the pages after it.
- Target against actual on every page that needs it
- Drill from a total down to the cause
- Refresh on a schedule, so no one rebuilds it each month
Case studies
Power BI projects we have delivered
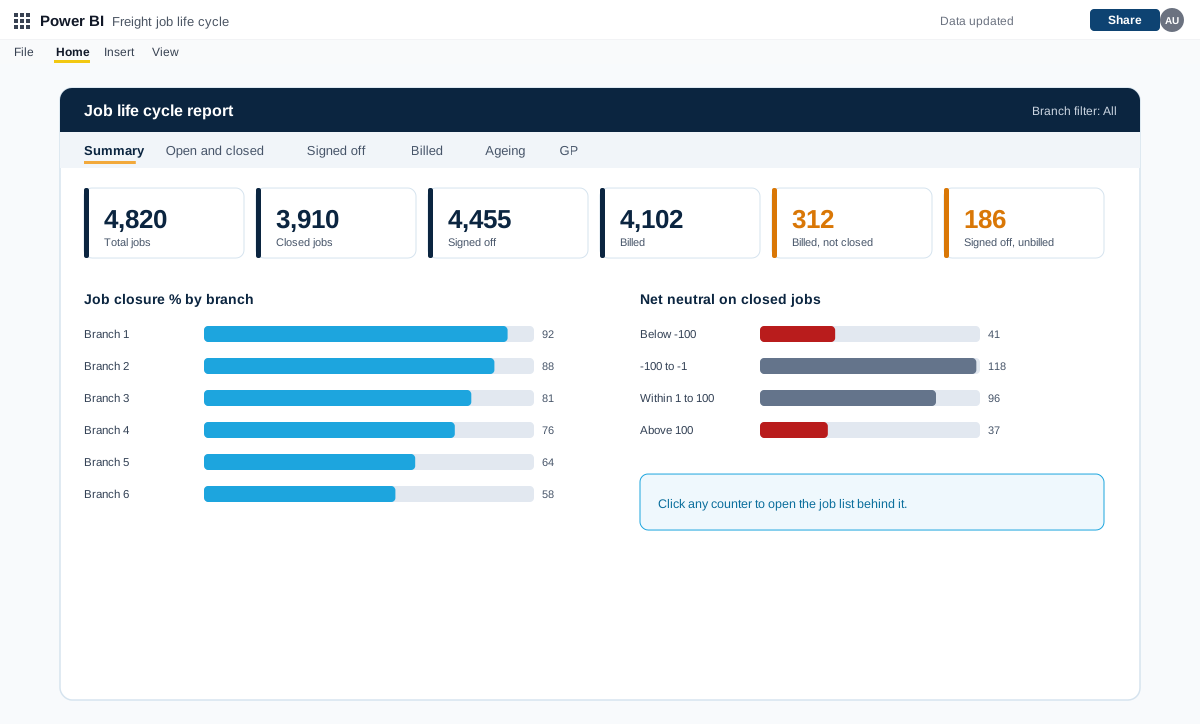
Power BI job life cycle, exception and debtors reports for a freight forwarder
A set of Power BI reports for a freight forwarding and customs clearing company with many branches. They follow every job from creation to closure and flag exceptions, pending billing, debtors and profit.
A freight forwarding and customs clearing company with many branches and a finance team at head office
Read the case study →Power BI · Energy and renewables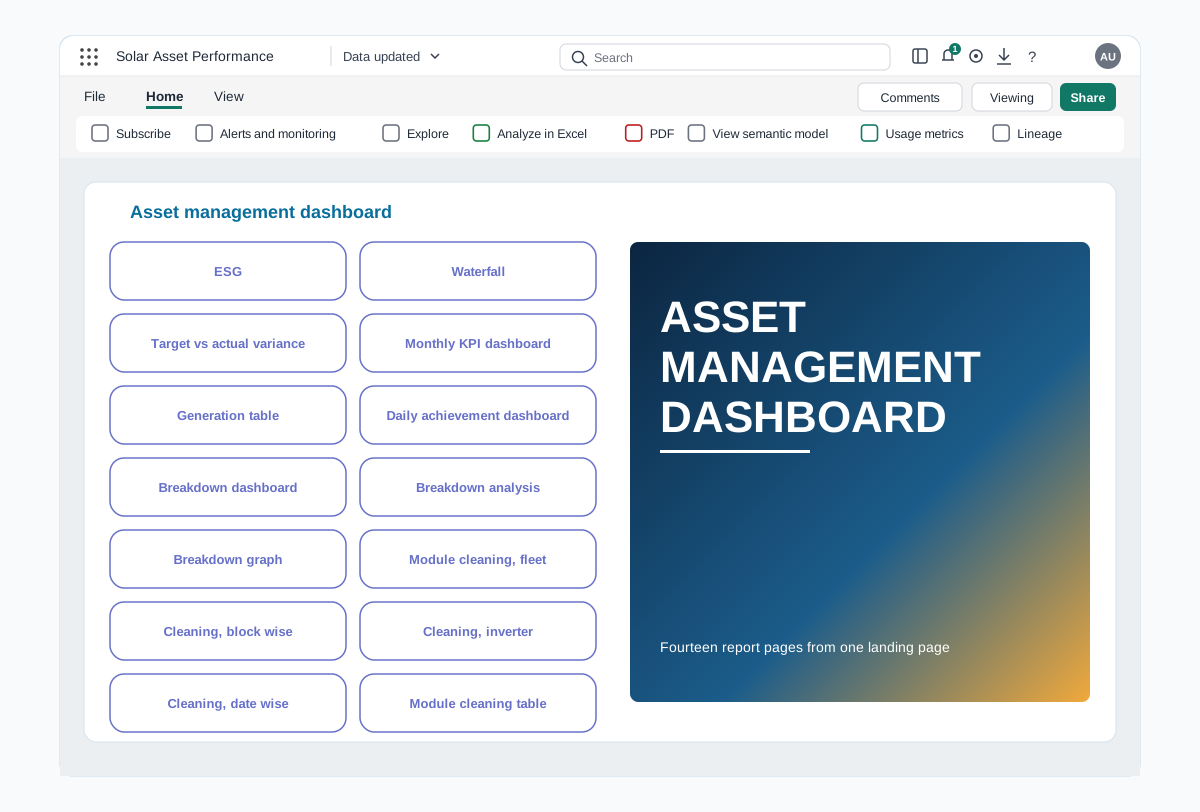
Power BI asset performance dashboards for a renewable energy portfolio
A Power BI report that follows generation, losses, breakdowns and module cleaning across every solar plant in a portfolio, from an executive summary down to the inverter.
A renewable energy company operating several solar plants
Read the case study →Power BI · Retail and consumer goods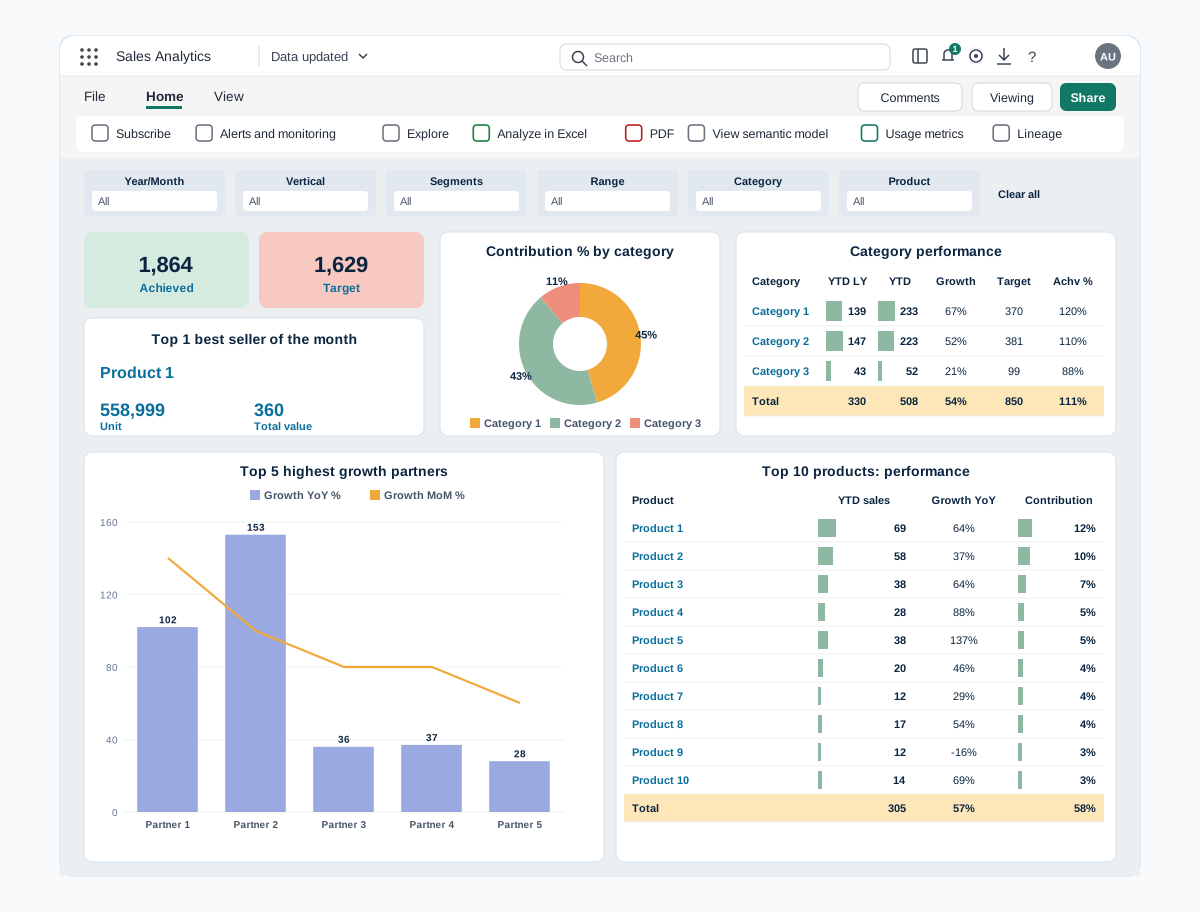
Power BI sales dashboards for digital channels and prescription sales
Two Power BI reports that bring sales data from every channel into one view. Digital sales covers partners, marketplaces, website and products, and Rx sales covers prescribers, zones, brands and field teams.
A skincare company selling through digital partners, its own website and prescription channels
Read the case study →Power BI development questions
What does a Power BI developer do?
A Power BI developer connects data sources, prepares and models the data, writes the measures, builds the report pages, sets up security and refresh, and hands the work over to your team.
Can you start from our Excel reports?
Yes. Many projects begin with Excel files that are rebuilt by hand each month. We move the logic into a data model so the report refreshes itself.
Will the dashboard work on a phone?
Yes. We can design a separate phone layout for the reports people check away from their desk.
Can different people see different data?
Yes. With row-level security, each person sees only the rows they are allowed to see, such as their own region or department.
Who owns the files at the end?
You do. We hand over the Power BI files and the notes on how the model works.
How do we get a price?
Book a free consultation. After a short scoping call we send a proposal with one price for the core scope, separate prices for optional add-ons, and the assumptions written down.
Contact