

Power BI reports and data models for Indian businesses in India.
Businesses across India still assemble monthly numbers by hand from Tally, ERP and Excel files. We build Power BI models and reports that refresh from source, delivered remotely with calls on Indian working hours.
Tell us about your project
Three common first projects.
One model from Tally, ERP and Excel
Ledger, sales and stock data shaped into a single model, with the same measures for every department.
Dashboards for owners and leaders
A short set of KPIs on one page, with drill-through to the detail each manager needs.
Row-level security by role
Each manager sees their own branch, region or business unit, set up and tested with your administrators.
Industries
Power BI for industries in India.
Examples of the solutions we build for organisations in these sectors.
Logistics
Delivery, fleet and warehouse dashboards that track performance against target.
Manufacturing
Production, quality and downtime dashboards that show the numbers on the shop floor.
Retail and consumer goods
Sales, stock and store performance reports by region, store and product.
Financial services
Management reporting, risk dashboards and monthly packs refreshed from your finance data.
Microsoft 365 and Power Platform
Power BI alongside Power Platform.
Power Apps captures the data, Power Automate moves it, and Power BI reports on it. We match the mix to your team.
Services
Choose how you want to work with us.
Most clients start with one dashboard set and grow from there.
Dashboard templates
Start from a role dashboard in India.
Start from a template built for your role, then adapt it to your data.
Leadership dashboards
Dashboards for CEOs and boards, with the headline numbers on one page.
Supply chain and inventory dashboards
Stock levels, supplier performance and order flow in one view.
Finance dashboards
Dashboards for CFO and FP&A teams, from the ledger to the management pack.
All dashboard templates
Every template, by function and industry.
Case studies
Power BI projects we have delivered
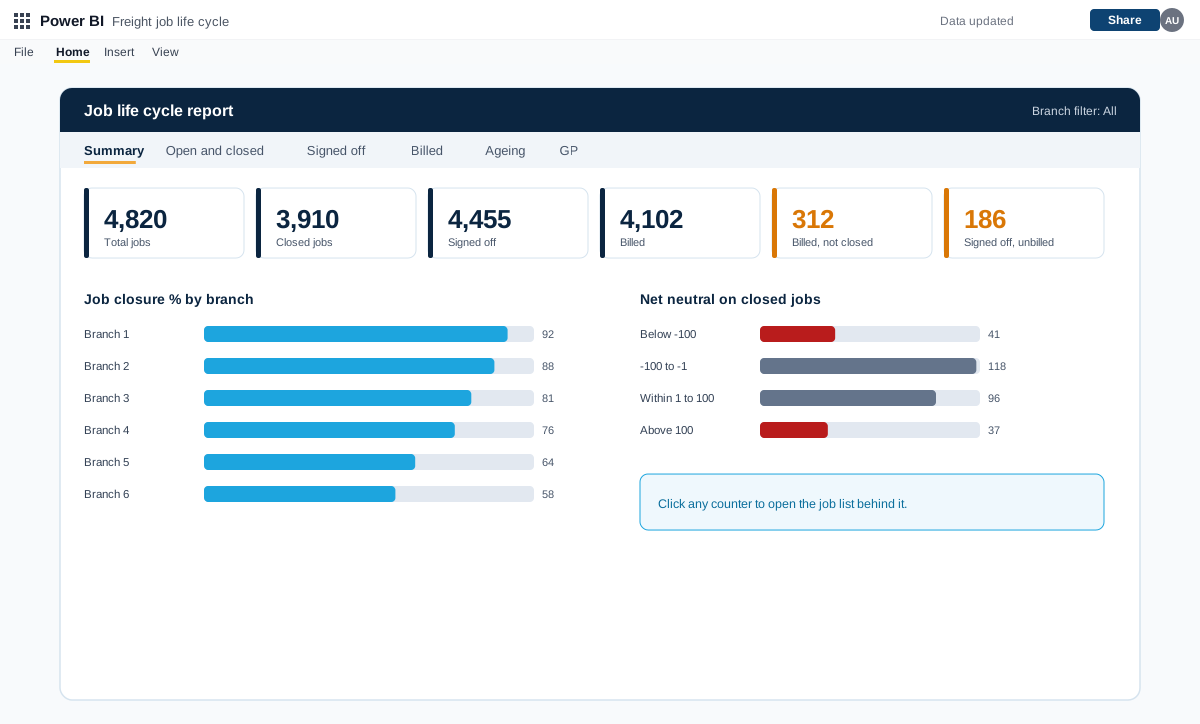
Power BI job life cycle, exception and debtors reports for a freight forwarder
A set of Power BI reports for a freight forwarding and customs clearing company with many branches. They follow every job from creation to closure and flag exceptions, pending billing, debtors and profit.
Read the case study →Power BI · Power Apps · SharePoint · Energy and renewables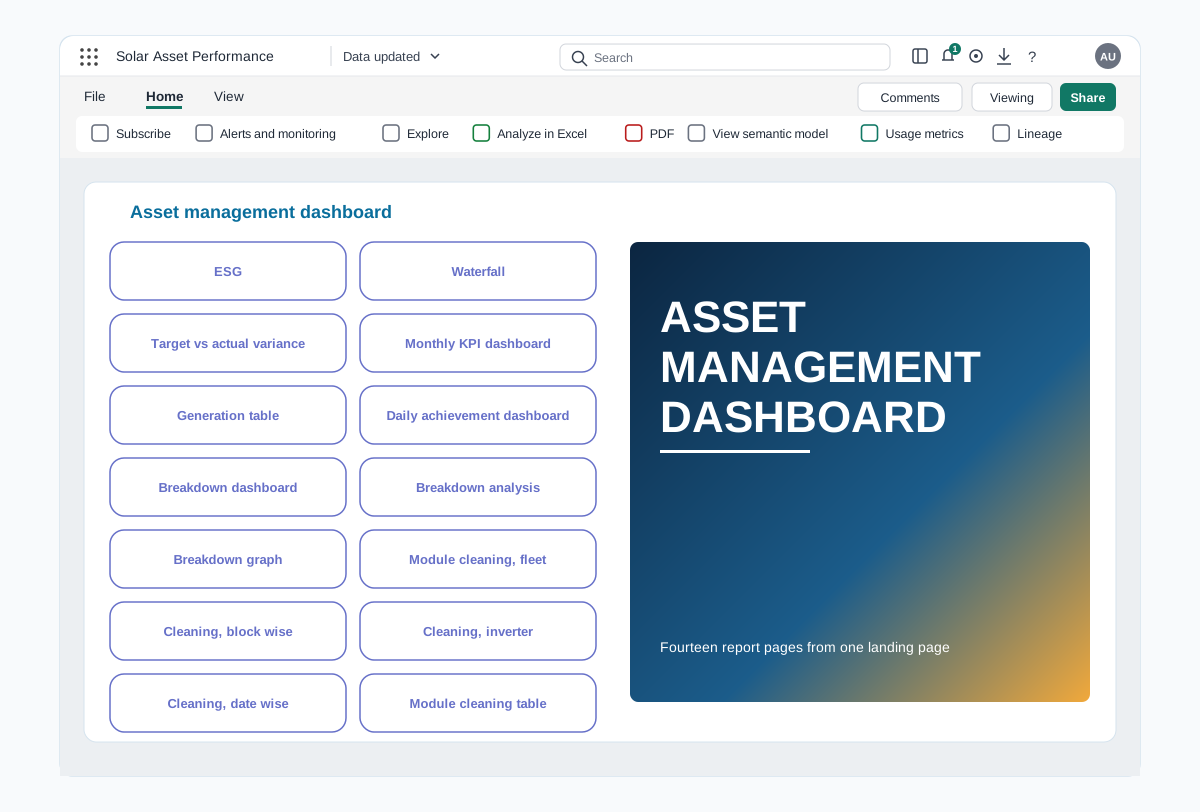
Power BI asset performance dashboards for a renewable energy portfolio
A Power BI report that follows generation, losses, breakdowns and module cleaning across every solar plant in a portfolio, from an executive summary down to the inverter.
Read the case study →Power BI · SharePoint · Retail and consumer goods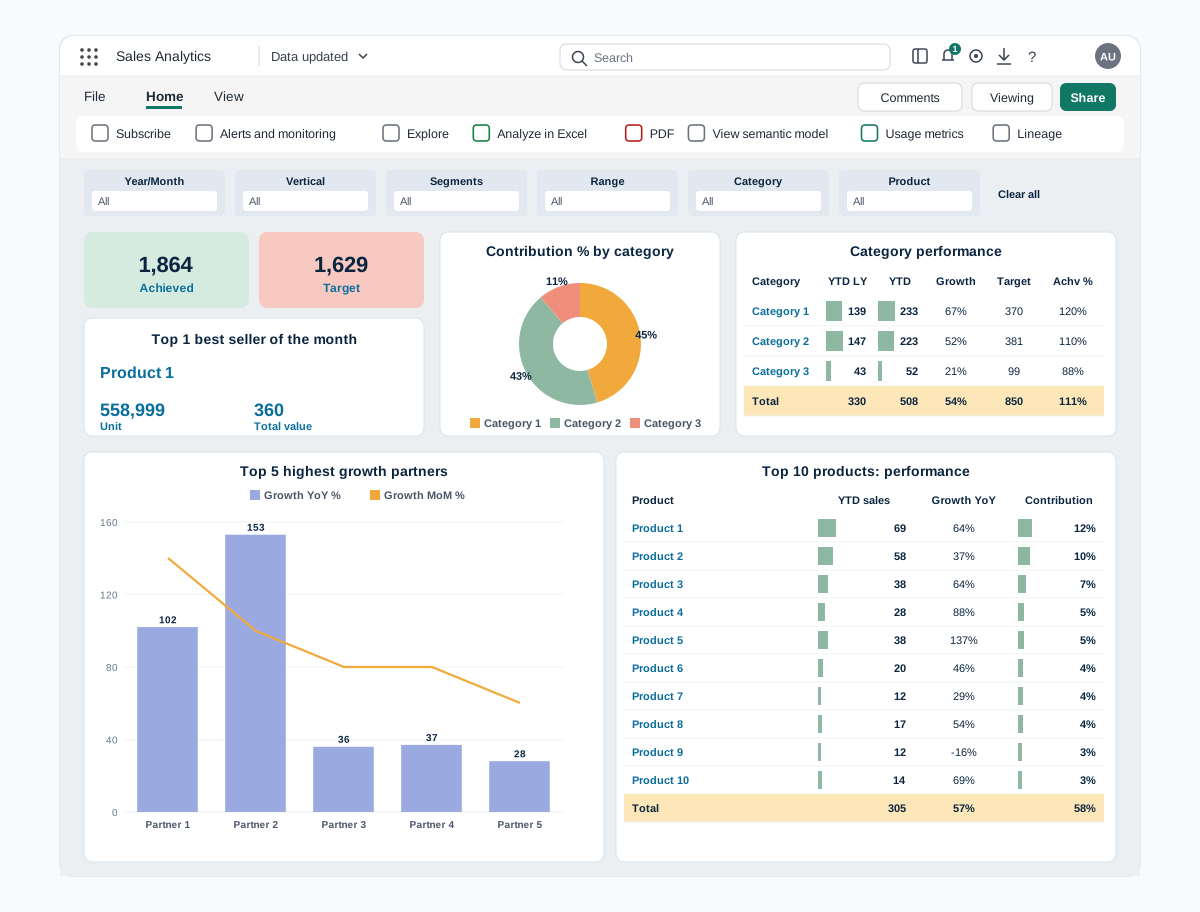
Power BI sales dashboards for digital channels and prescription sales
Two Power BI reports that bring sales data from every channel into one view. Digital sales covers partners, marketplaces, website and products, and Rx sales covers prescribers, zones, brands and field teams.
Read the case study →Questions from India teams
Can you connect Tally and our ERP?
Yes. We confirm each source and its refresh needs in discovery, then agree the route that keeps numbers current without manual exports.
Can you take over reports built by someone else?
Yes. A review documents what exists, then we agree what to keep, fix or rebuild.
How do you price a Power BI project?
We scope it in discovery and agree a fixed price for a defined set of reports, or a monthly allocation for ongoing work.
Quick enquiry