

Power BI dashboards for hospitals and clinics
A healthcare dashboard shows how full the hospital is, how patients are doing, and whether claims turn into cash. Three screens cover it. We build them on your own hospital, clinical and billing data.
Request the sample pack
What it answers
Three questions every hospital team is asked
Each screen starts from a question. The figures are the ones that help administrators, clinical leads and the finance team act this week.
- How full are we, and where is capacity tight?Beds available, ICU occupancy, admissions today and average length of stay, with admissions and discharges by hour, occupancy by department and the wards close to full.
- Are patients getting better, and how fast do we treat them?Readmission rate, treatment turnaround, recovery rate and quality indicators, with the patient journey step by step and performance by department and physician.
- Are we billing correctly and collecting what we bill?Net revenue, claim approval rate, outstanding receivables and revenue per patient, with revenue by department, the insurance and self-pay split, and claims by status.
The screens
Power BI healthcare dashboard screens
Three screens for hospital administrators, clinical leads and finance. Open one to see it full size. Each comes with filters and drill-through, and we adjust measures, filters and branding to your organisation.
3 dashboards
Every number on these screens is sample data from a fictional hospital group. No patient, client or hospital data is shown. Your own logo replaces the AscenWork mark at the top left of each report.
How we define the main healthcare measures
Hospital figures only compare across wards and months when they are counted the same way every time. We agree how occupancy, length of stay, readmissions and claims are calculated before we build.
| Measure | How we calculate it | What to agree first |
|---|---|---|
| Bed occupancy | Occupied beds divided by staffed beds, by ward and department. | Whether closed or blocked beds count as staffed. |
| Average length of stay | Total inpatient days divided by discharges in the period. | Whether day cases and transfers are included. |
| 30-day readmission rate | Patients readmitted within 30 days of discharge, divided by discharges. | Which planned readmissions are excluded. |
| Treatment turnaround | Minutes from registration to the start of treatment. | The start point your teams record. |
| Claim approval rate | Claims approved on first submission divided by claims submitted. | How resubmitted claims are counted. |
| Collection rate | Cash collected divided by net revenue billed in the period. | The cut-off day for each month. |
How it works
From these screens to your live dashboard
In a project, the dashboard connects to your hospital information, clinical and billing data and refreshes on a schedule. You see working pages early, so you react to something real.
Connect
We link your hospital information system, admissions and discharge records, clinical quality data and billing system, and check the data is complete.
Model
We join patients, admissions, departments, physicians and claims into one healthcare model, with the definitions agreed with you.
Design
We build operations, clinical and billing pages, in your look and logo.
Go live
Reports run with scheduled refresh and access by role, so each user sees only the data they are allowed to see.
What we connect
Where the data for these dashboards comes from
We confirm the sources on a short scoping call. These are the common ones for this dashboard.
Hospital information system
Admissions, discharges, bed and ward records, and theatre schedules.
Clinical and quality records
Outcomes, readmissions, turnaround times and quality indicators, from clinical systems or the sheets your teams keep.
Billing and claims
Charges, claims, payments and receivables from your billing or accounts system.
Departments and physicians
Your department and physician lists, so figures are compared against the right owner.
Access by role
Row-level security, so a department head sees their own department and administrators see the whole hospital.
Our Power BI work
These screens are one part of what we do on Power BI
From hospital dashboards to report design for clinical teams, pick the part of your healthcare reporting that needs work.
Power BI development
Connect your hospital information system, clinical records and billing, and build the occupancy, readmission and claims measures with access by role.
Power BI consulting
A review of the hospital reports you run today, and a plan for what each team needs to see before you build.
Power BI designing
Operations, clinical and billing pages that are clear for administrators and clinical leads.
Copilot and AI for Power BI
Ask about bed use, readmissions and claims in plain language, within what each person may see.
Case studies
Power BI projects we have delivered
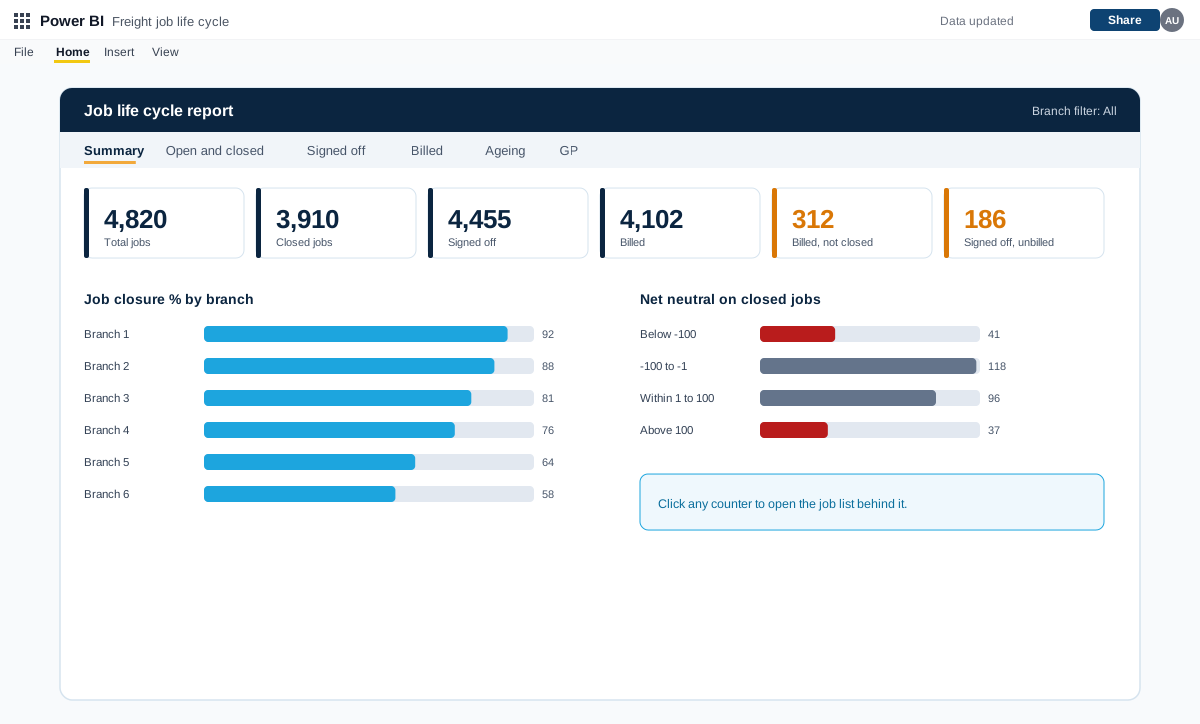
Power BI job life cycle, exception and debtors reports for a freight forwarder
A set of Power BI reports for a freight forwarding and customs clearing company with many branches. They follow every job from creation to closure and flag exceptions, pending billing, debtors and profit.
Read the case study →Power BI · Power Apps · SharePoint · Energy and renewables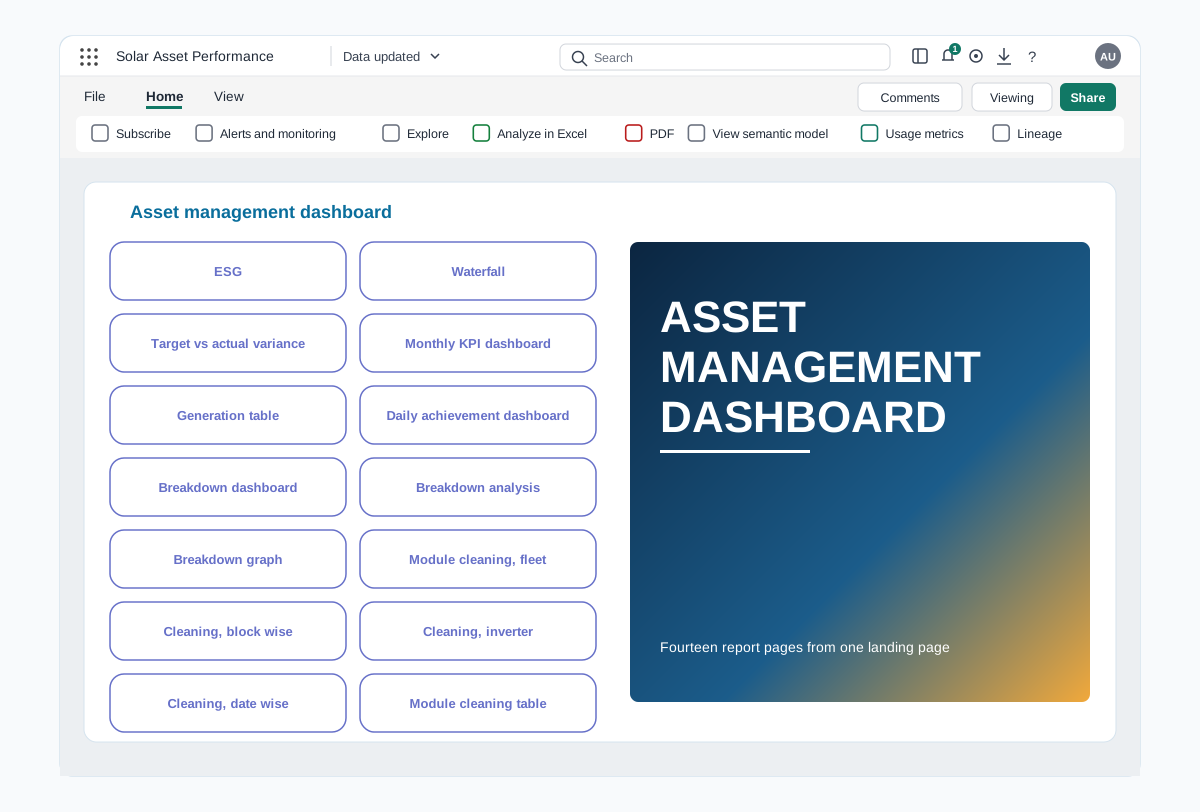
Power BI asset performance dashboards for a renewable energy portfolio
A Power BI report that follows generation, losses, breakdowns and module cleaning across every solar plant in a portfolio, from an executive summary down to the inverter.
Read the case study →Power BI · SharePoint · Retail and consumer goods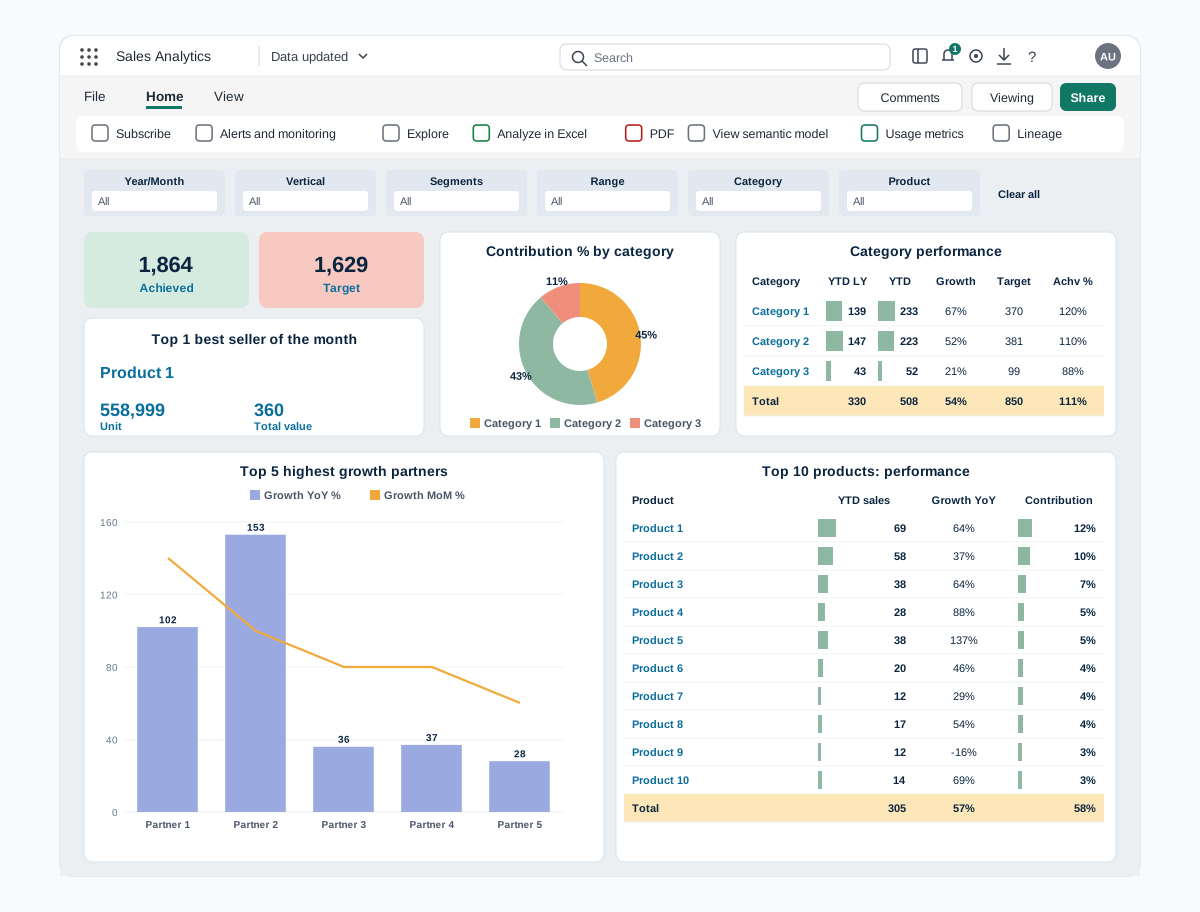
Power BI sales dashboards for digital channels and prescription sales
Two Power BI reports that bring sales data from every channel into one view. Digital sales covers partners, marketplaces, website and products, and Rx sales covers prescribers, zones, brands and field teams.
Read the case study →Trusted by teams at












Power BI healthcare dashboard questions
What should a healthcare dashboard show?
Bed use and admissions for operations, readmissions and turnaround for clinical quality, and claims and collections for finance. Start with the decisions each team takes every week.
How do you measure readmission rate?
Patients readmitted within 30 days of discharge, divided by discharges. We agree which planned readmissions are excluded before the first build.
Can it connect to our hospital information system?
Usually yes. Power BI connects to common hospital and billing systems, databases, Excel and SharePoint. We confirm each source on a scoping call.
Can a department head see only their own department?
Yes. With row-level security, each head sees their own department, while administrators see the whole hospital.
Is the sample pack free?
Yes. The design pack is free, and we email it to you as a PDF. Building dashboards on your own data is a scoped, paid engagement, which we quote after a discovery call.
How do we get a price and a timeline?
Book a free call. We learn your data sources, users and questions, then send a proposal with the scope, the assumptions and the price. Timelines depend on the number of sources and dashboards.
Related
More from our Power BI work
All dashboard templates
Dashboards by function and industry
Manufacturing dashboards
Production, quality and inventory
Finance dashboards
Cash, receivables and budget screens
HR analytics dashboards
Headcount, attrition and hiring
Power BI development
Build a dashboard on your own data
Power BI consulting
Review and plan before you build
Power BI designing
Clear, fast report design
Hire Power BI developers
Developers who join your team
Contact