

Power BI dashboards for store operations
A store operations dashboard shows how each store and region is performing, which stores are behind, and whether staffing and shrink are under control. Three screens cover the network. We build them on your own store and point-of-sale data.
Request the sample pack
What it answers
Three questions every operations lead is asked
Each screen starts from a question. The figures help store managers and regional leads act in the same week.
- How are stores performing across the network?In-store net sales, sales per square foot, footfall conversion and labour cost as a share of sales, with sales against target by format and region.
- Which stores are doing well, and which are behind?Average basket, footfall, target attainment and open stores, with store sales on a map and a ranking of stores by sales.
- Are we staffed to the right level, and where is shrink highest?Labour cost, visits and sales per labour hour, labour cost by region, and shrink by store shown as a heatmap.
The screens
Power BI store operations screens
Three screens for the operations lead. Open one to see it full size. Each comes with filters and drill-through, and we adjust measures, filters and branding to your business.
3 dashboards
Every number on these screens is sample data from a fictional retailer. No client data is shown. Your own logo replaces the AscenWork mark at the top left of each report.
How we define the main store operations measures
A dashboard is only trusted if everyone reads the same number. We agree these definitions with you before we build, and write them down at handover.
| Measure | How we calculate it | What to agree first |
|---|---|---|
| Sales per square foot | In-store net sales divided by selling area, for the period. | Whether storage space is part of the selling area. |
| Footfall conversion | Transactions divided by footfall counted at the door. | Whether footfall counters are reliable in each store. |
| Average basket | Net sales divided by the number of transactions. | Whether returns are netted off. |
| Labour cost as a share of sales | Labour cost divided by net sales for the period. | Whether overtime and agency staff are included. |
| Shrink | Stock lost to theft, damage and error, as a share of sales. | The stock count date and how losses are recorded. |
How it works
From these screens to your live dashboard
In a project, the dashboard connects to your store data and refreshes on a schedule. You see working pages early, so you react to something real.
Connect
We link your systems and files, and check the data is complete.
Model
We clean and join the data, and agree each measure with you so everyone reads the same number.
Design
We apply your chosen look and your logo to every page, with a phone layout where it is needed.
Go live
The dashboard runs in Power BI with scheduled refresh, filters, drill-through and access by role.
What we connect
Where the data for these dashboards comes from
We confirm the sources on a short scoping call. These are the common ones for this dashboard.
Point of sale
Store sales, transactions and average basket from your point-of-sale system.
Footfall counters
Door counts by store and by hour, where you have counters in place.
Rosters and timesheets
Staff hours and visits from your rostering or timesheet system.
Stock counts and shrink
Stock count results and recorded losses by store.
Store master
Store format, size and region, so stores are compared fairly.
Access by role
Row-level security, so a store manager sees their own stores and the operations lead sees the network.
Our Power BI work
These screens are one part of what we do on Power BI
The same team builds the data model behind the dashboard, designs the report and keeps it running. Pick the part you need.
Power BI development
Data connections, model, measures, row-level security and scheduled refresh, built in your Power BI.
Power BI consulting
A review of your current reports and data, and a plan before you build.
Power BI designing
Clear, fast report design with a consistent look across every page.
Copilot and AI for Power BI
Ask questions of your data in plain language, with the right guardrails.
Case studies
Power BI projects we have delivered
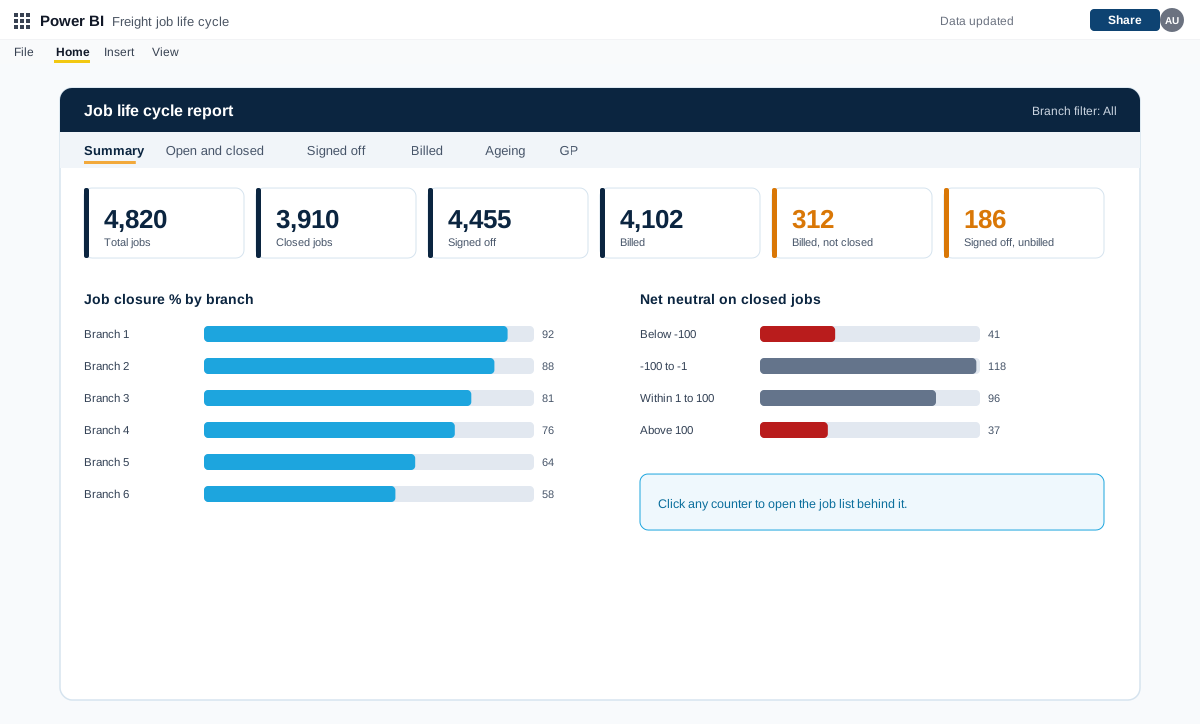
Power BI job life cycle, exception and debtors reports for a freight forwarder
A set of Power BI reports for a freight forwarding and customs clearing company with many branches. They follow every job from creation to closure and flag exceptions, pending billing, debtors and profit.
A freight forwarding and customs clearing company with many branches and a finance team at head office
Read the case study →Power BI · Energy and renewables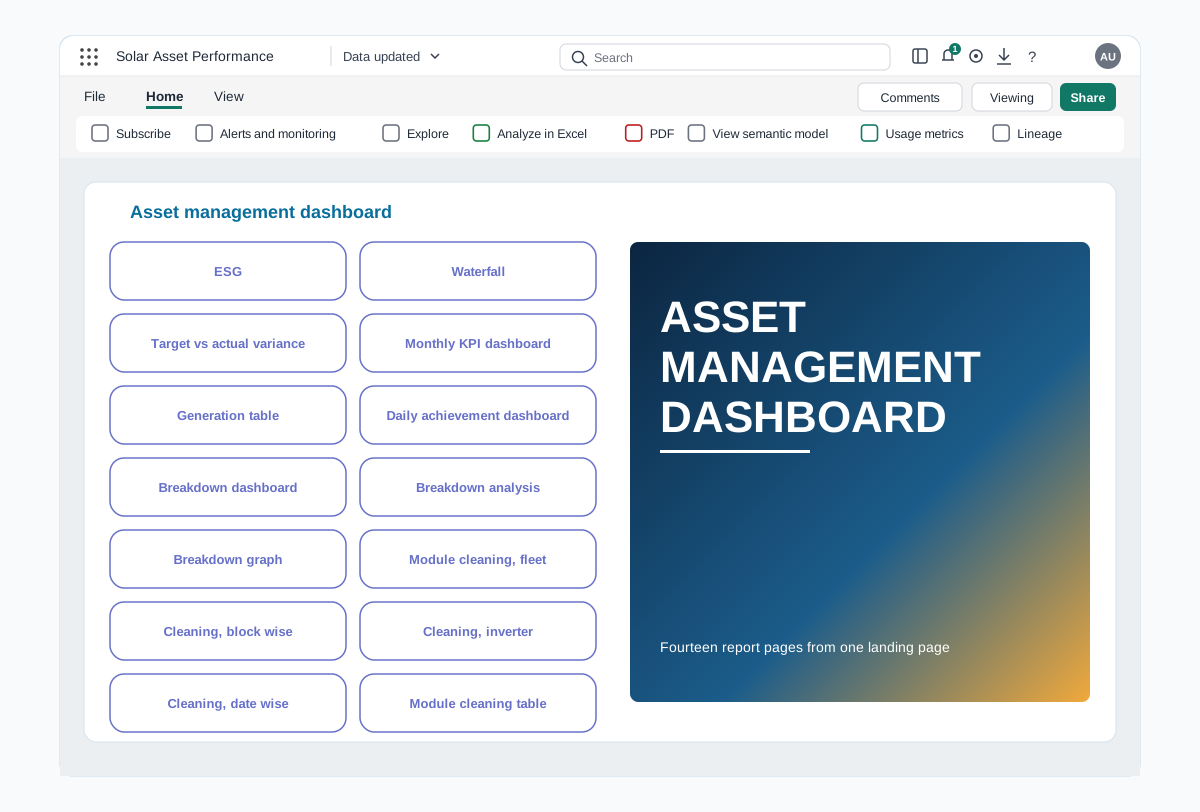
Power BI asset performance dashboards for a renewable energy portfolio
A Power BI report that follows generation, losses, breakdowns and module cleaning across every solar plant in a portfolio, from an executive summary down to the inverter.
A renewable energy company operating several solar plants
Read the case study →Power BI · Retail and consumer goods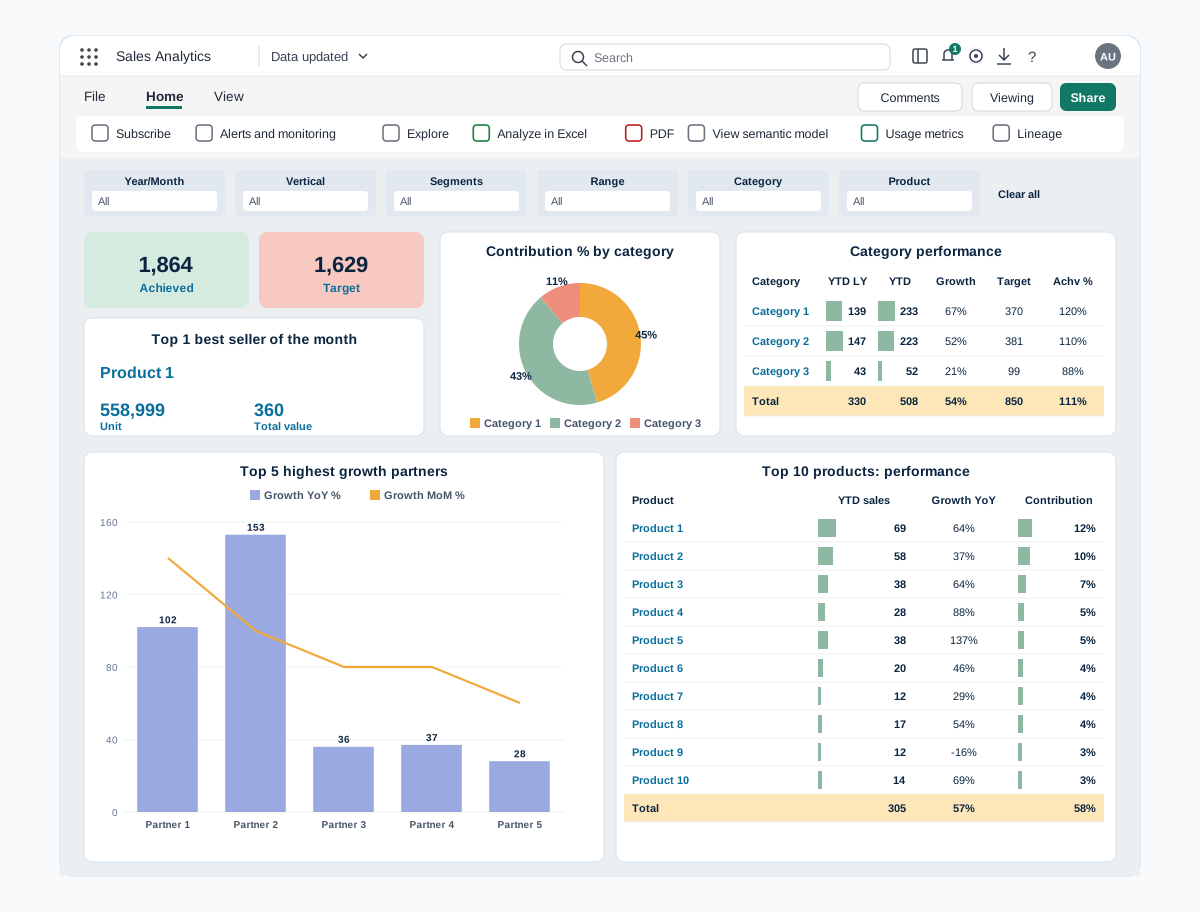
Power BI sales dashboards for digital channels and prescription sales
Two Power BI reports that bring sales data from every channel into one view. Digital sales covers partners, marketplaces, website and products, and Rx sales covers prescribers, zones, brands and field teams.
A skincare company selling through digital partners, its own website and prescription channels
Read the case study →Trusted by teams at












Power BI store operations dashboard questions
What should a store operations dashboard show?
Sales against target by store and region, footfall conversion, average basket, labour cost and shrink. Start with the decisions that store managers and regional leads take each week.
Our stores have different sizes. Can the figures still be compared?
Yes. Sales per square foot and sales per labour hour put stores of different sizes on the same footing. We agree the measures with you before the build.
Can a store manager see only their own stores?
Yes. With row-level security, a store manager sees their own stores, while regional leads and the operations head see the network.
What if we do not have footfall counters?
The dashboard still works. Footfall conversion needs counter data, so we show the screens that do not depend on it and tell you what a counter would add.
Is the sample pack free?
Yes. The design pack is free, and we email it to you as a PDF. Building dashboards on your own data is a scoped, paid engagement, which we quote after a discovery call.
How do we get a price and a timeline?
Book a free call. We learn your data sources, users and questions, then send a proposal with the scope, the assumptions and the price. Timelines depend on the number of sources and dashboards.
Related
More from our Power BI work
All dashboard templates
Fifteen dashboards by function and industry
E-commerce dashboards
Online sales, funnel and returns
Merchandising dashboards
Range, pricing and discounts
Retail and consumer goods
How we work with this sector
Power BI development
Build a dashboard on your own data
Power BI consulting
Review and plan before you build
Power BI designing
Clear, fast report design
Hire Power BI developers
Developers who join your team
Contact